Visualize: Heat Map
The last tab of the Visualizations page is called Heat Map. It contains a single card called Expression Heat Map.
In order to populate this tab you’ll need to include at least one gene in the Gene Basket. The Expression Heat Map card updates automatically when genes are added/removed from the Gene Basket. For further information about how to populate the Gene Basket see the Gene Basket article.
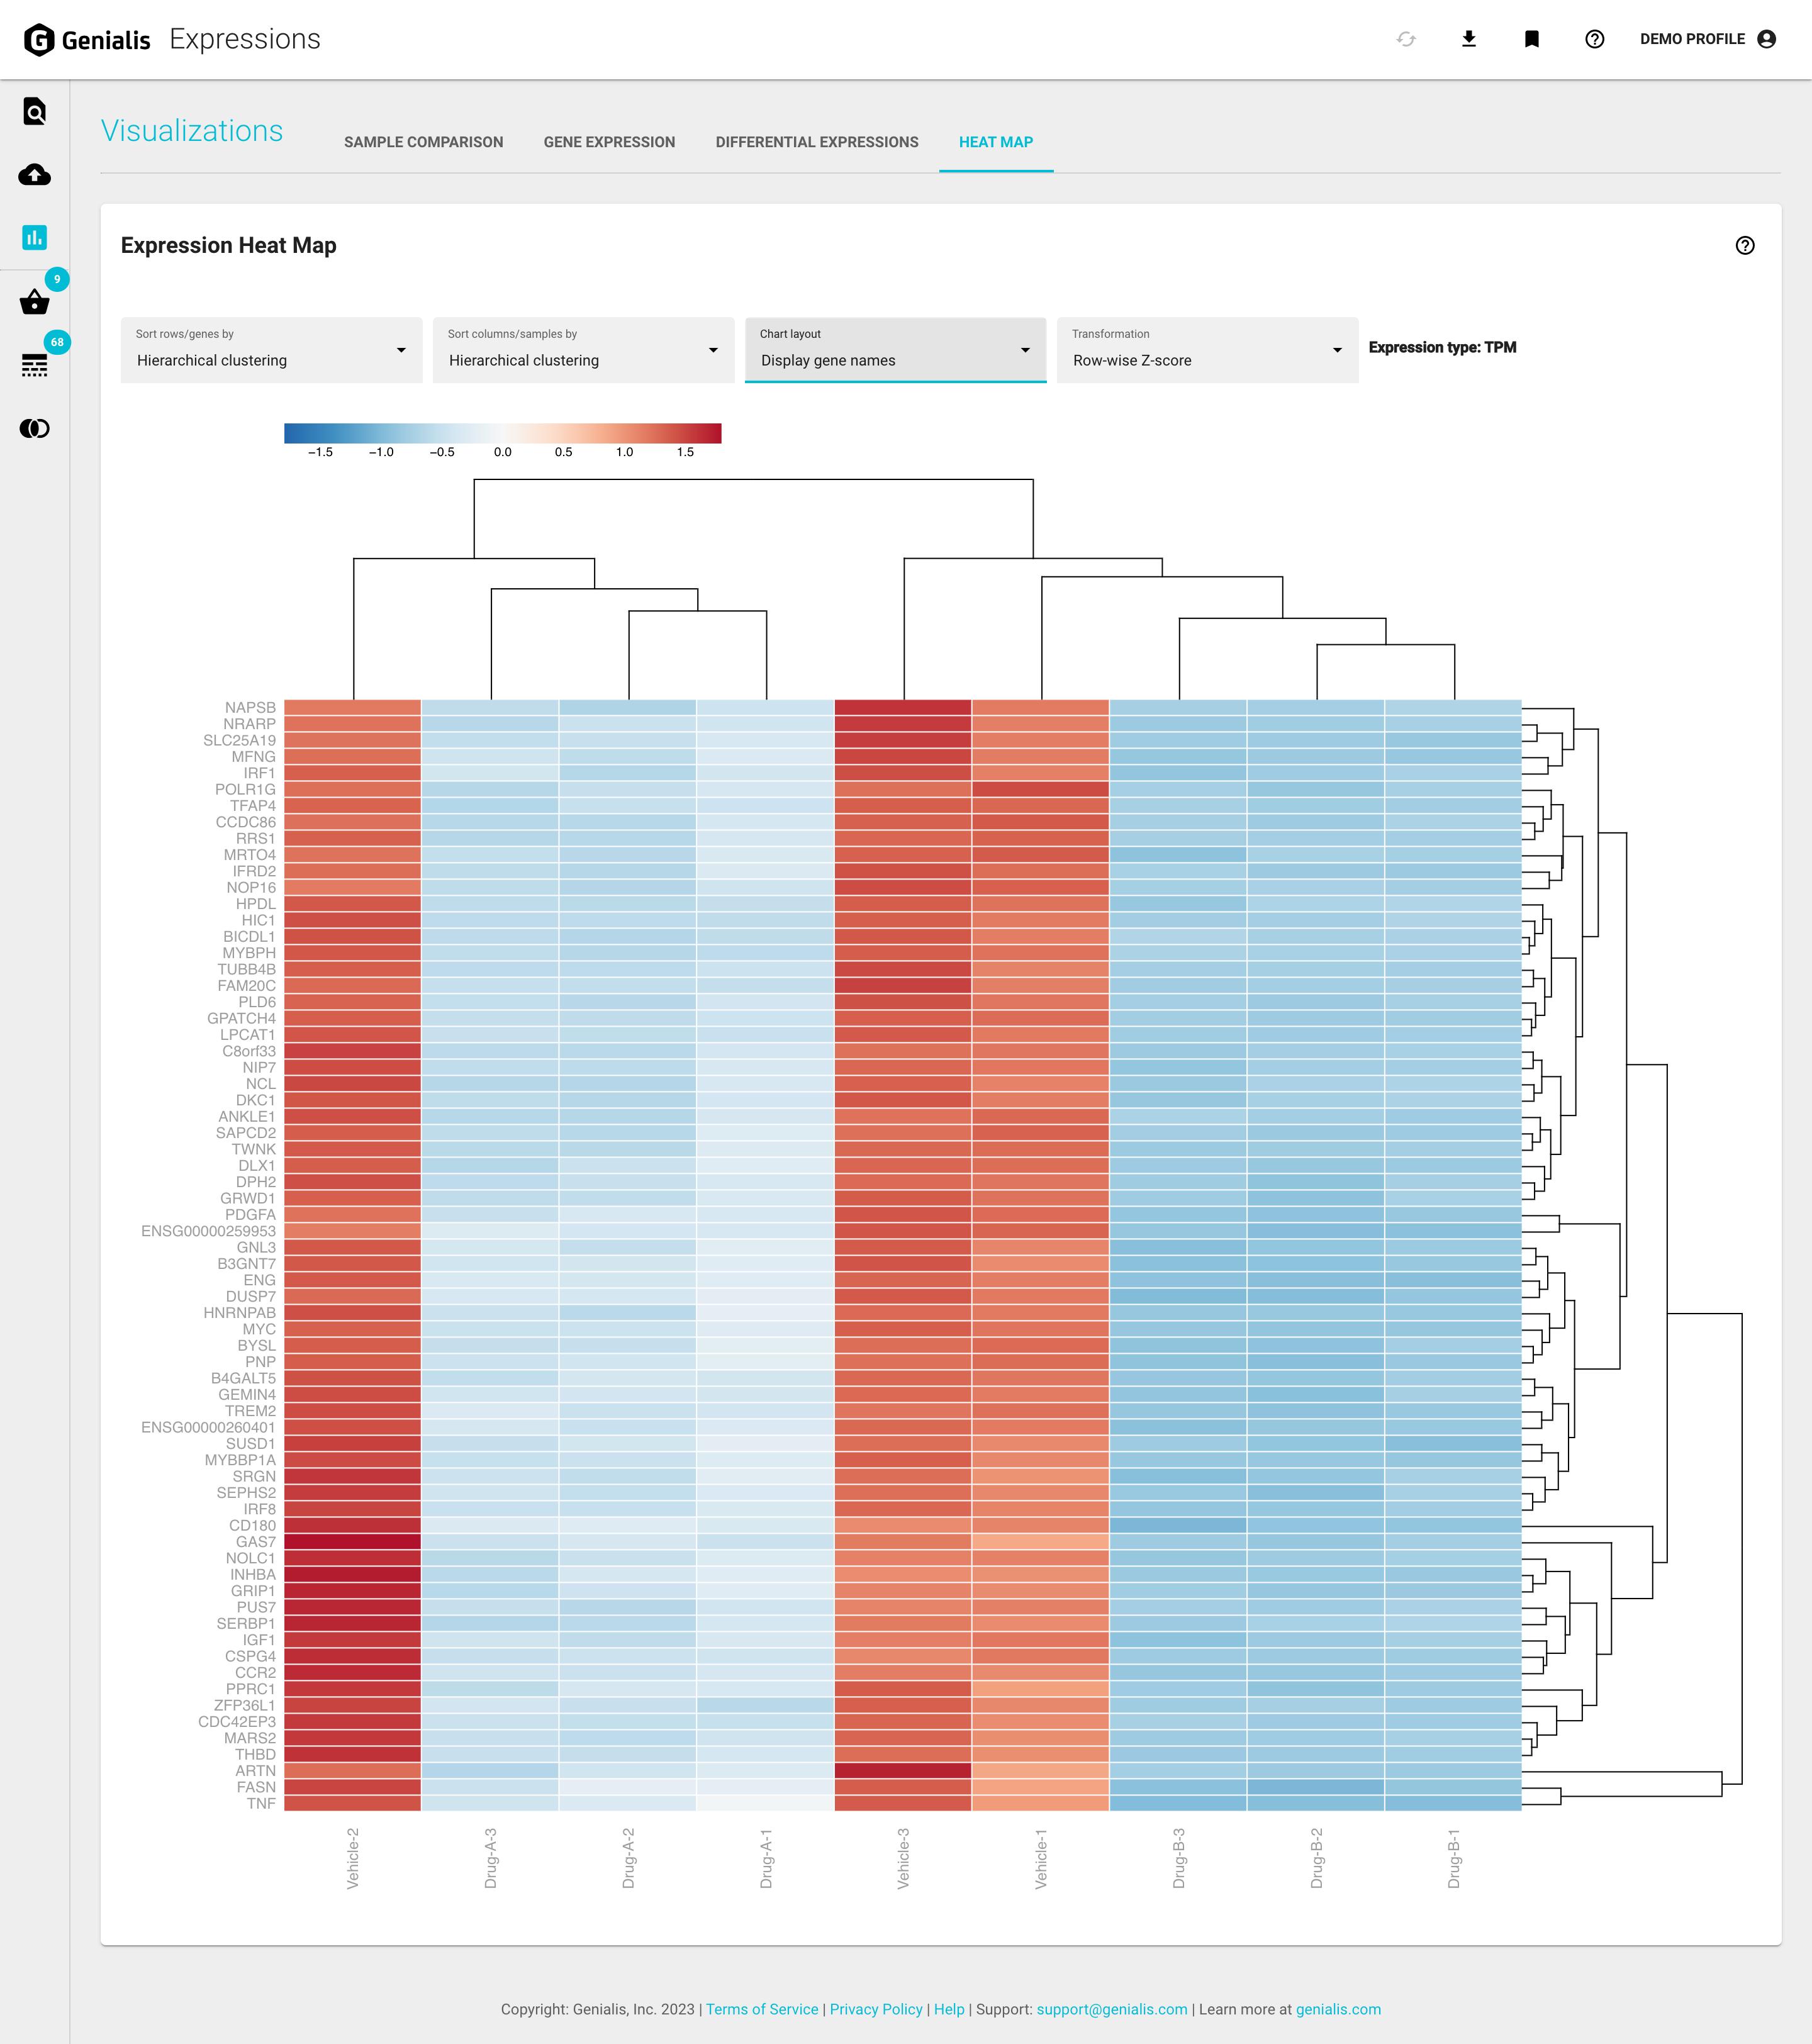
The Expression Heat Map plots quantitative differences in expression levels of selected genes in each individual sample in the basket to allow a qualitative overview of the transcriptomic landscape. The user may consider known biomarkers, novel genes of interest or look more closely at differentially expressed genes identified in the Differential Expressions tab.
The rows in the heat map represent the selected genes in the Gene Basket and the columns represent the selected samples in the Sample Basket.
Both rows and columns can be clustered using the Sort drop-down menus. By default, items are ordered alphabetically however you can choose to sort them by the average linkage function using Pearson distance to reveal which genes display the most similar expression patterns, and which samples are most alike for this selection of genes.
In the Chart layout drop-down menu you can choose between a view with a gene name displayed at the beginning of each row or a more simplified and condensed view without the gene names.
Using the Transformation drop-down menu you can transform the data by row-wise Z-score (default), log2, or Z-score of log2. Selecting a data transformation will recompute clustering (if selected) and adjust the color scale accordingly.
Mouse hover over any cell in the heat map matrix reveals additional information.
Download heat map results
If you are interested in downloading your expression heat map results, click on the ‘Export’ icon button in the top right of your screen (in the top bar). A modal window will appear where you can put down an optional prefix for the exported file and start the download by clicking the ‘EXPORT’ button.

This will download a zipped report file that contains:
- Expression Heat Map folder:
-A suggested caption text (.txt) -Results table (.tsv*) -Raster and vector plot image (.png and .svg)
- Gene Basket folder:
-Information about the highlighted and selected genes in the Gene Basket (.tsv*)
- Sample Basket folder:
-A list of selected samples in the Sample Basket (.tsv*)
*TSV (tab-separated-value) format files are plain-text tabular files that can be imported into any spreadsheet program.