View Sample Details
You can access the Sample Details page by clicking on a sample name either:
in the results table from Samples tab on the Search page or
in the Samples card from within the Collection Details page.
The Sample Details page contains 3 cards:
Overview
Primary Analysis History
Sample Annotation
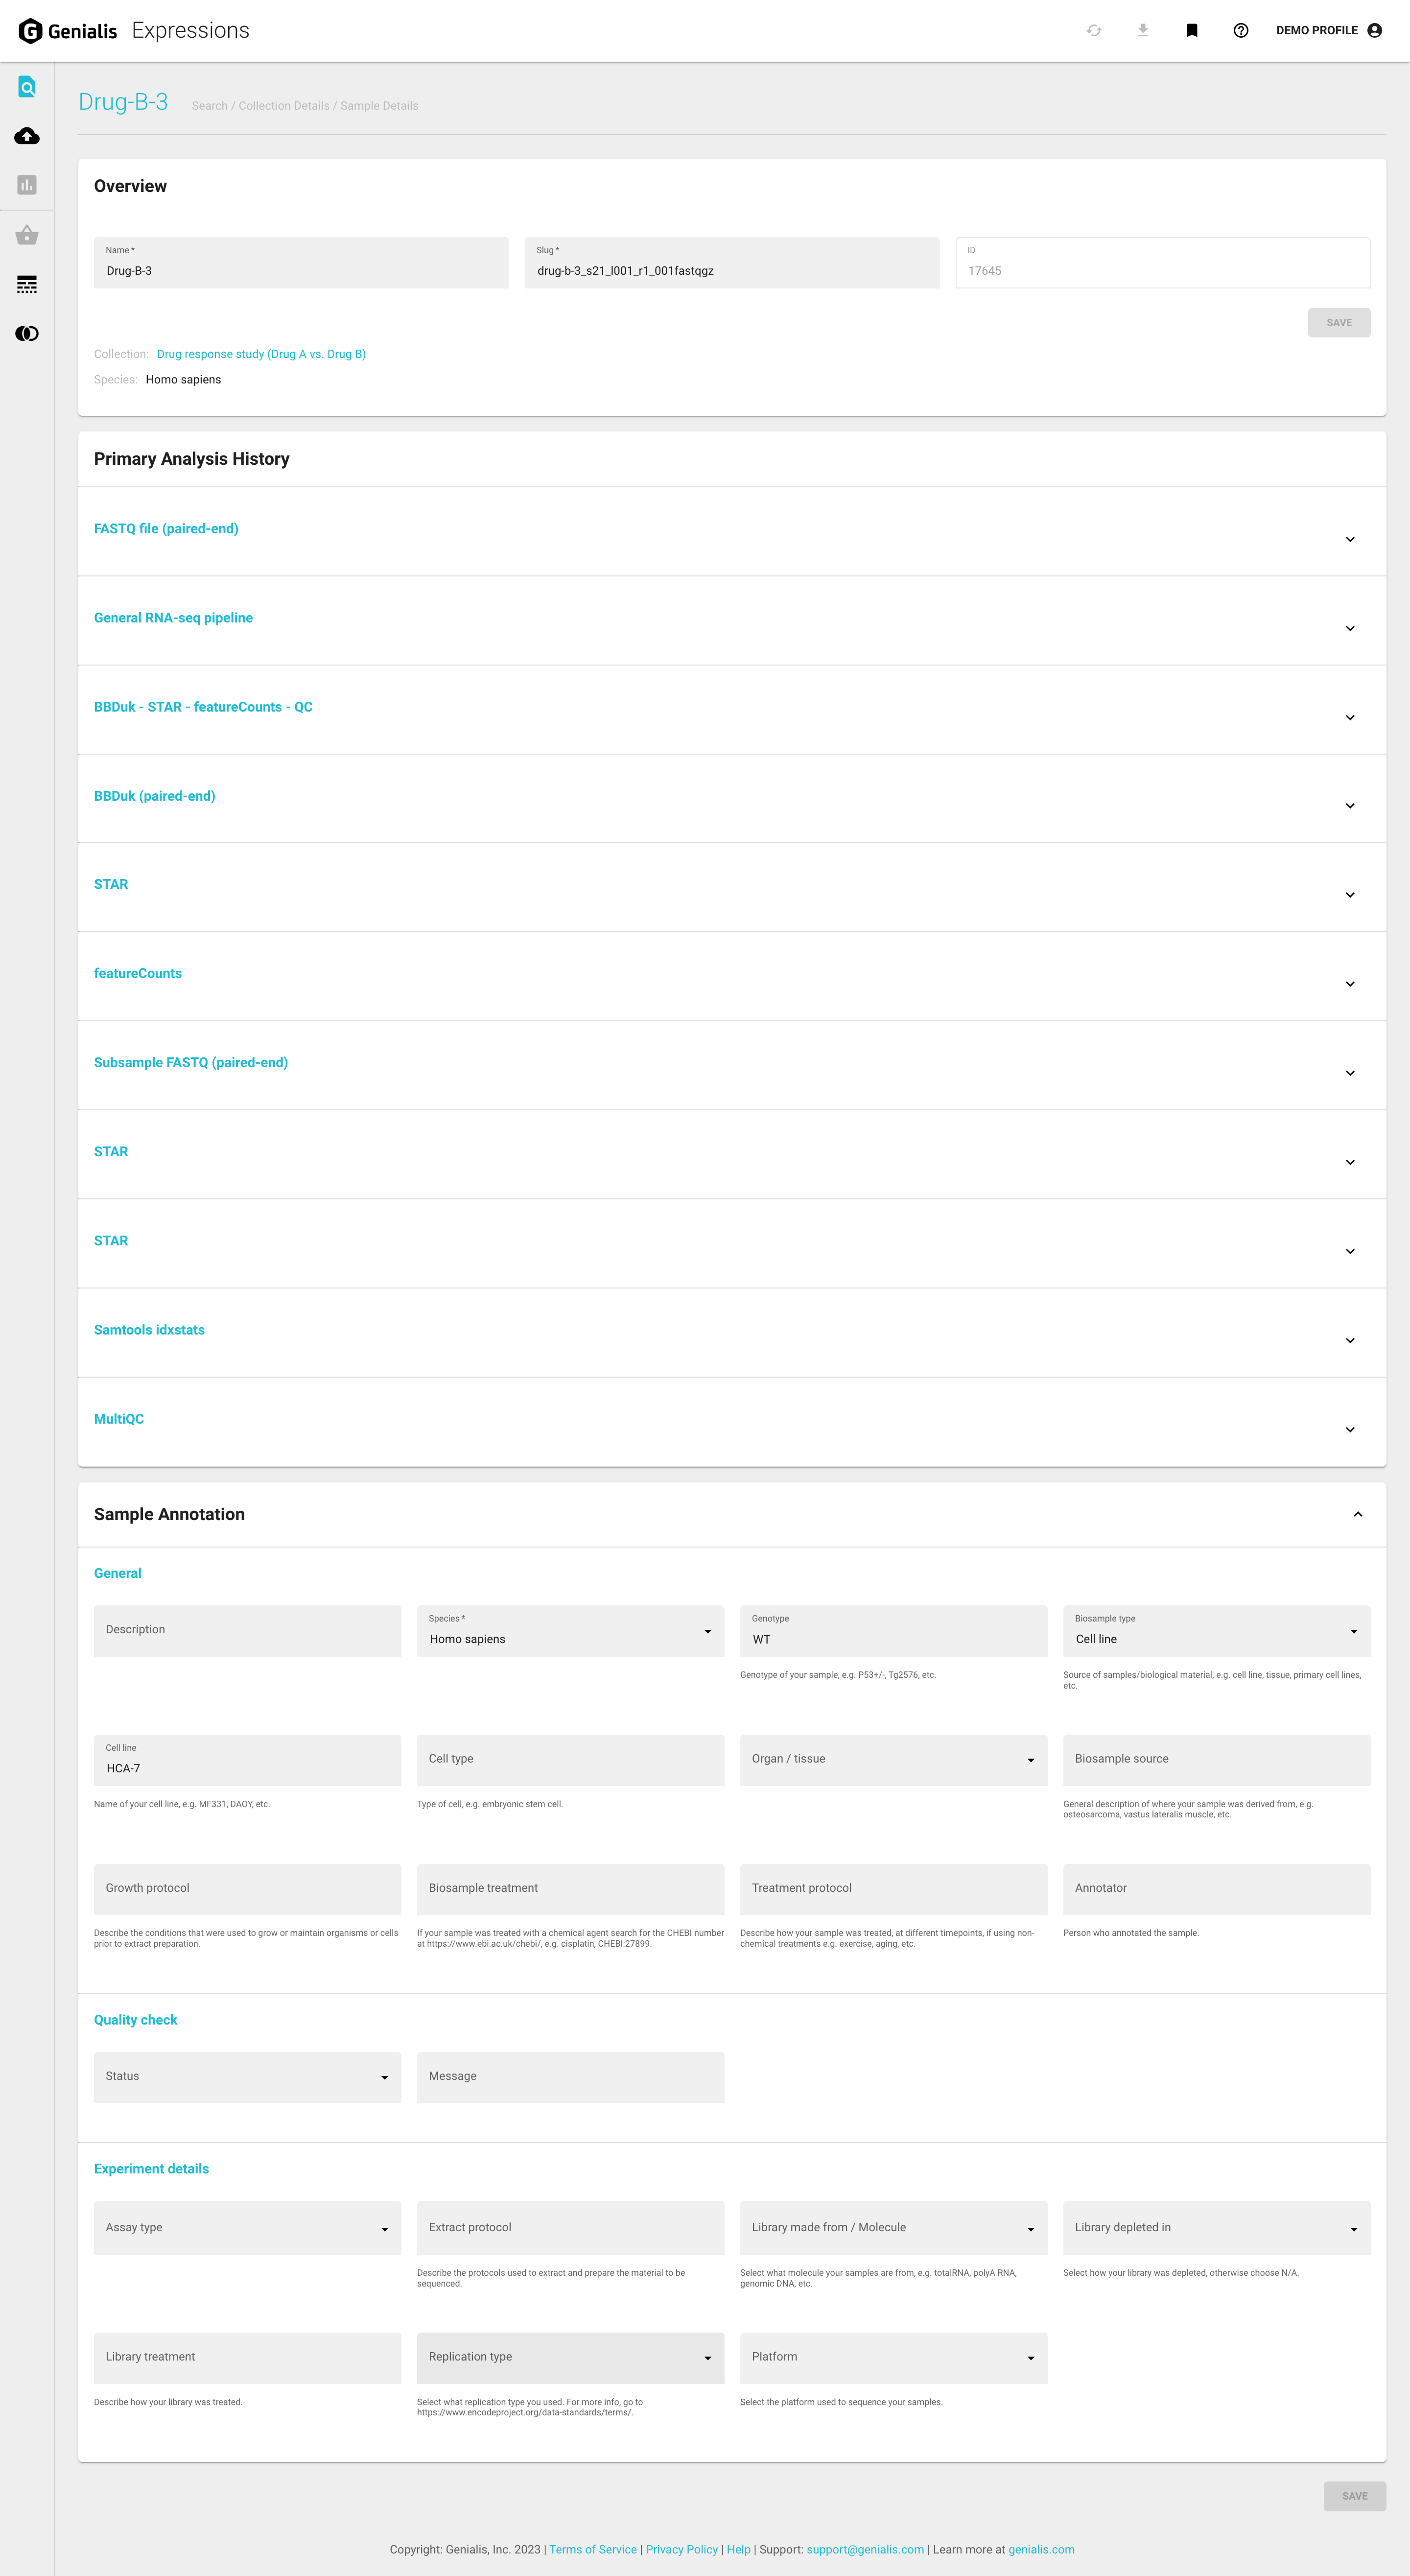
Overview card
The sample name, URL slug (both editable) and ID, Species and Collection name (not editable) are shown here. Sample ID and URL slug come in handy for debugging purposes by the Genialis support team.
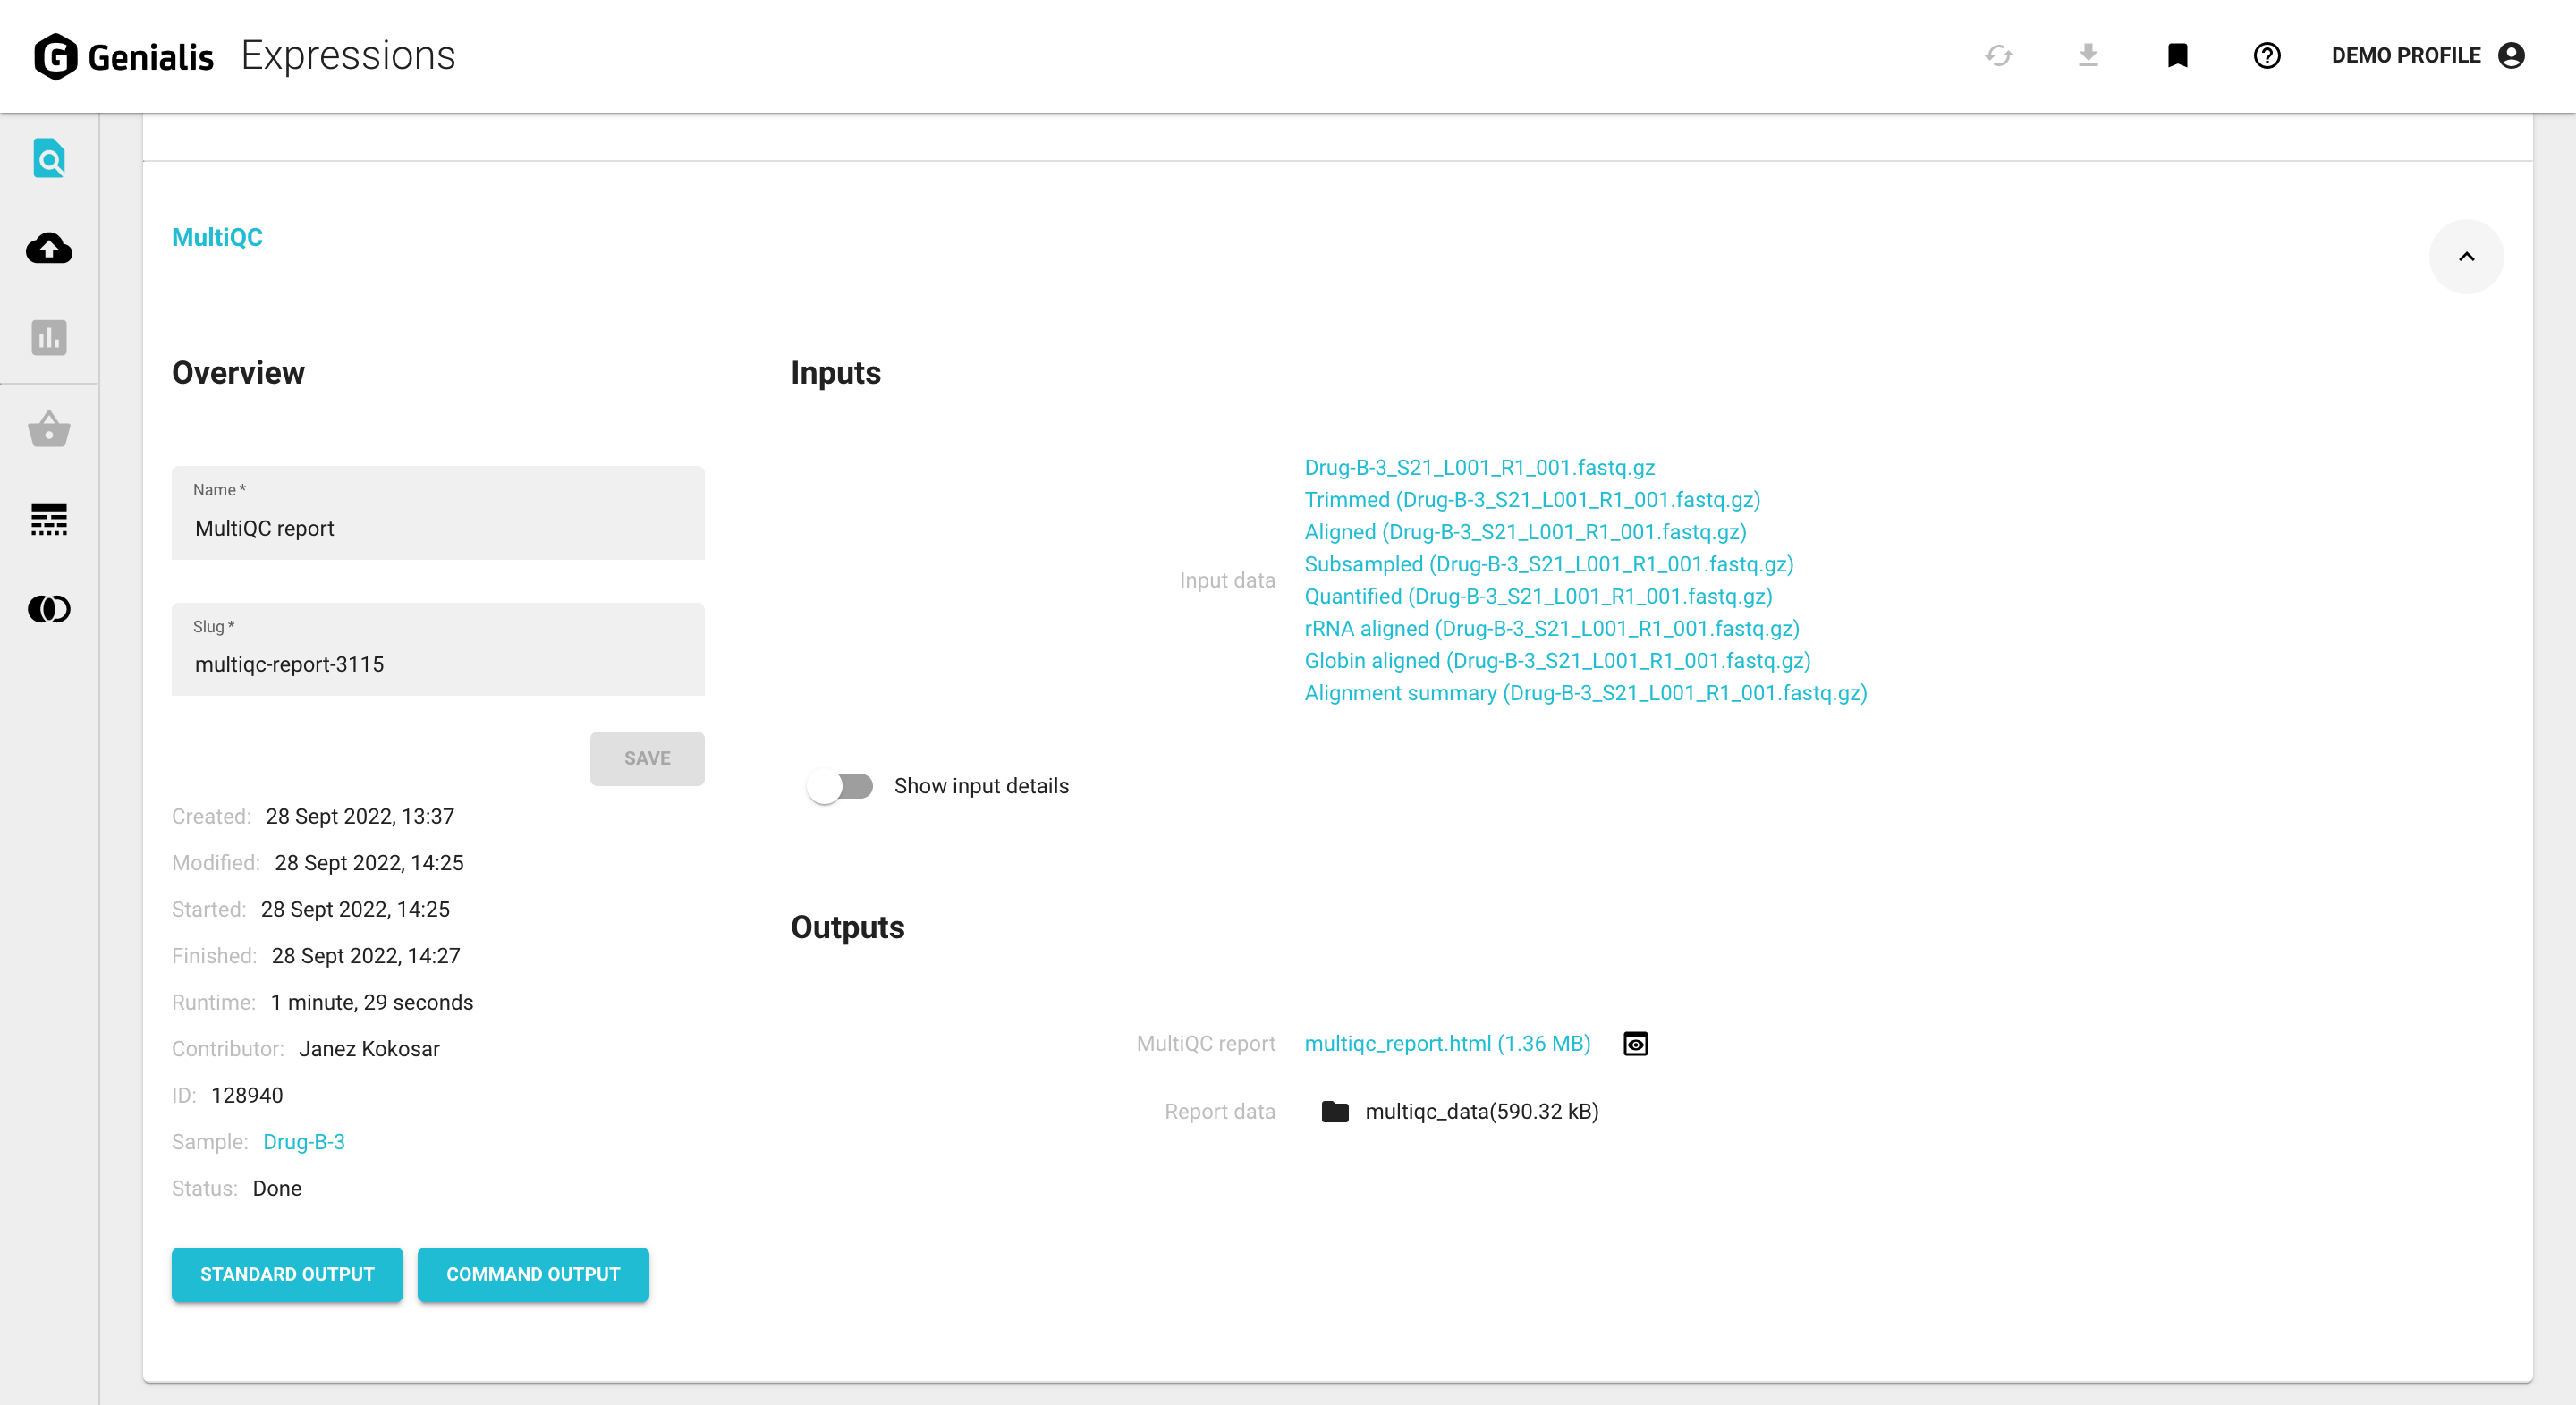
Primary Analysis History card
Sample history is key if you need to troubleshoot your analysis, publish the methods, download an intermediate results file, or understand how the data was processed. For each processed sample, Genialis Expressions records the history, sequence, and runtime details of every analysis step carried out on that data to ensure data provenance.
Each analysis step is shown as a separate section in an expandable/collapsable harmonica format and includes:
Overview
Displays some general information regarding the process (analysis type, data object name, data object URL slug, sample name, ID, contributor) as well as some performance metrics (date and time details, runtime duration and status, which will also explain any potential errors that may have occurred during the analysis).
Inputs
Inputs are different for each step, the input of one is often the output of the previous.
Outputs
Outputs are different for each step, the output of one is often the input for the next. You can view or download most of them.
The ‘STANDARD OUTPUT’ button opens the standard output in a new tab
The ‘COMMAND OUTPUT’ button opens the command output in a new tab
Sample Annotation card
The Sample Annotation card displays a variety of annotation fields such as species, genotype, experimental details, descriptions, etc.
These metadata are important for several reasons:
You cannot publish without submitting the data AND metadata to a public repository.
Recording metadata is essential to reproducibility and is a basic best practice (often overlooked).
The color-by and group-by for the box plots and bar charts are dependent on these sample details.
You can find out more about how to annotate samples in the Annotate Samples article.
