View Collection Details
Clicking on a collection name from the Collections tab on the Search page will open the Collection Details page, which contains three cards:
Actions
Samples
Data Objects
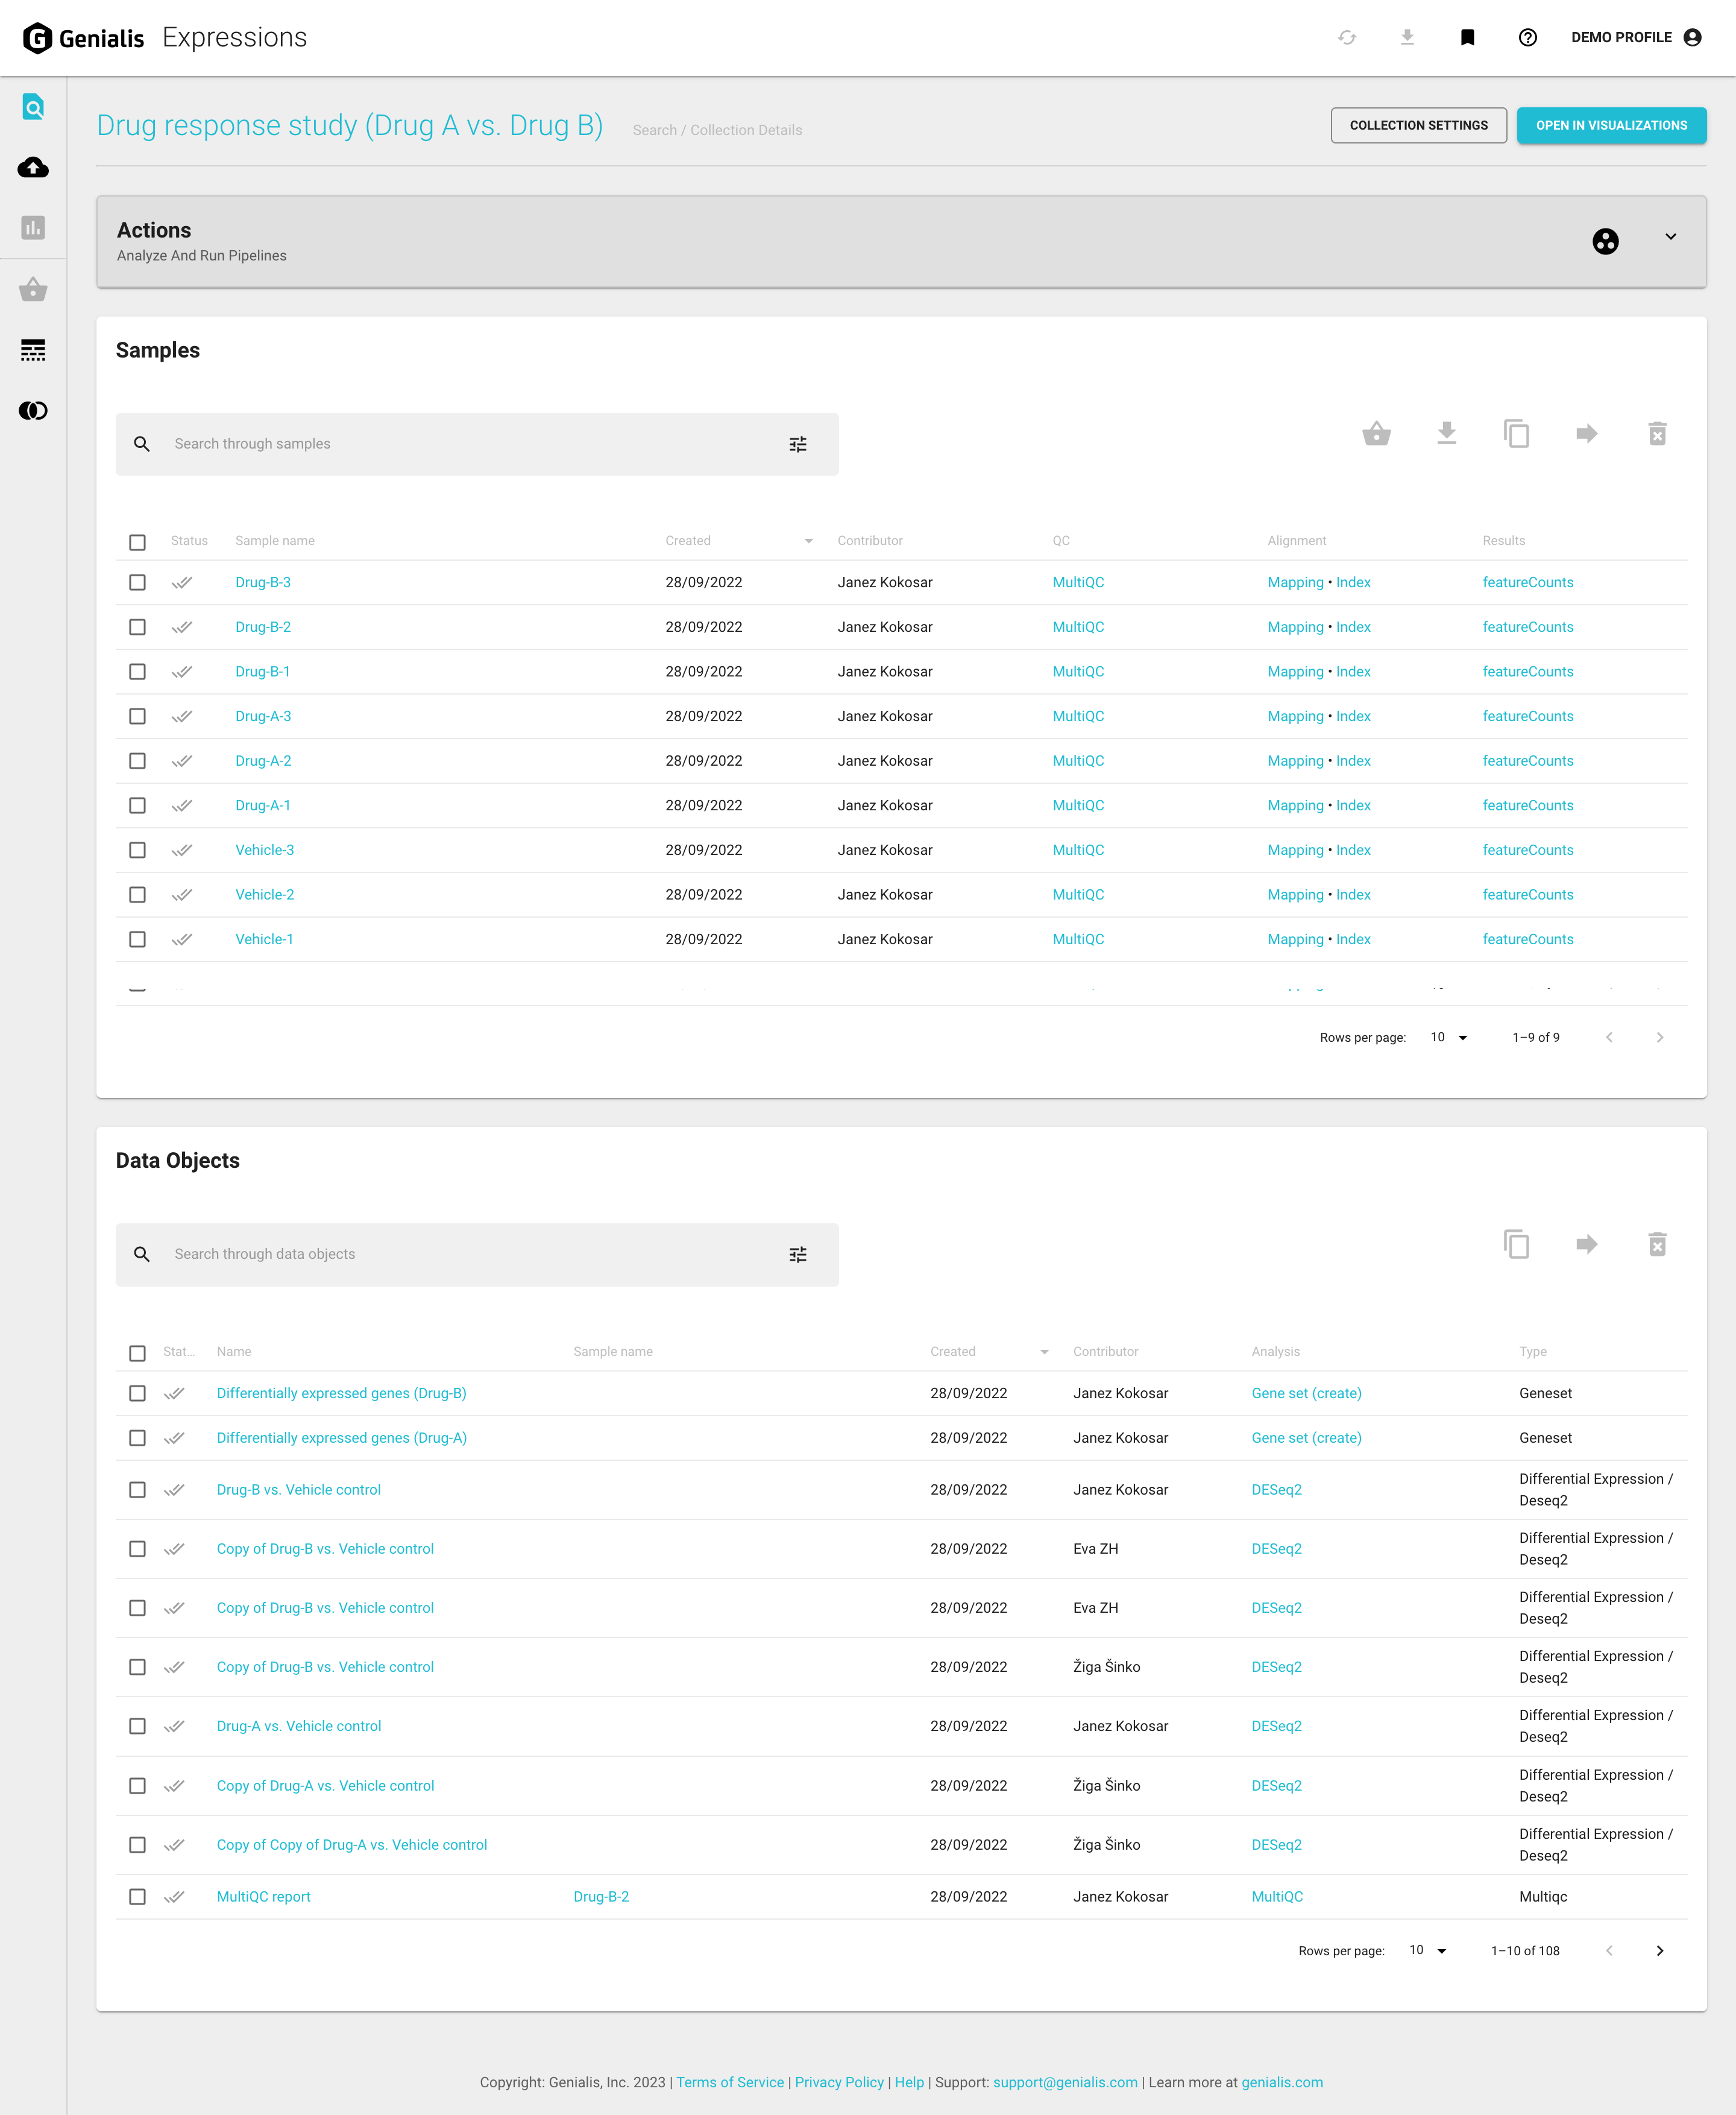
The ‘OPEN IN VISUALIZATIONS’ button in the upper right corner of the page will automatically put all the samples of the collection into the Sample Basket and open the Visualizations page. For more information about visualizing data in Genialis Expressions visit the articles in the Data Visualization section.
The settings for a collection can be viewed and managed on the Collection Settings page. You can access the settings by clicking on the ‘COLLECTION SETTINGS’ button found in the upper right corner of the page.
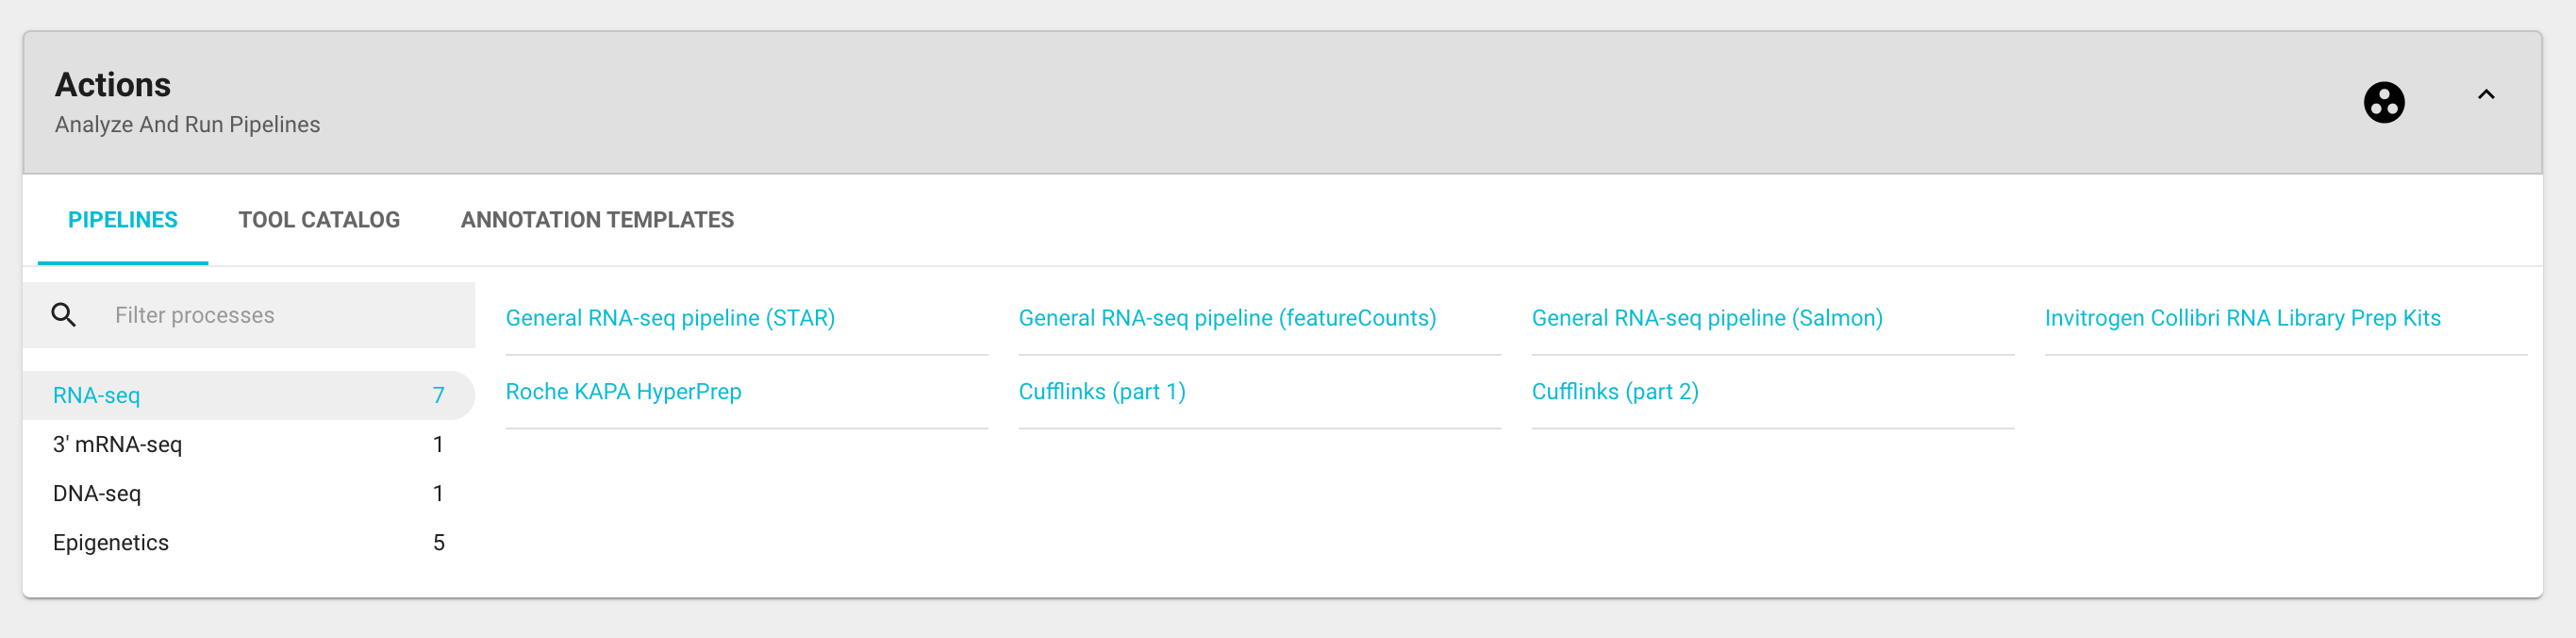
Actions card
The Actions card is where you can run pre-configured pipelines, any of the a la carte tools that are available, update your collection metadata, or view your processed data. The majority of actions are divided in three tabs:
The Pipelines tab is where you will find preconfigured pipelines that can be run on your samples. For further information on running the tools and processes, visit the Run Bioinformatic Tools and Pipelines article.
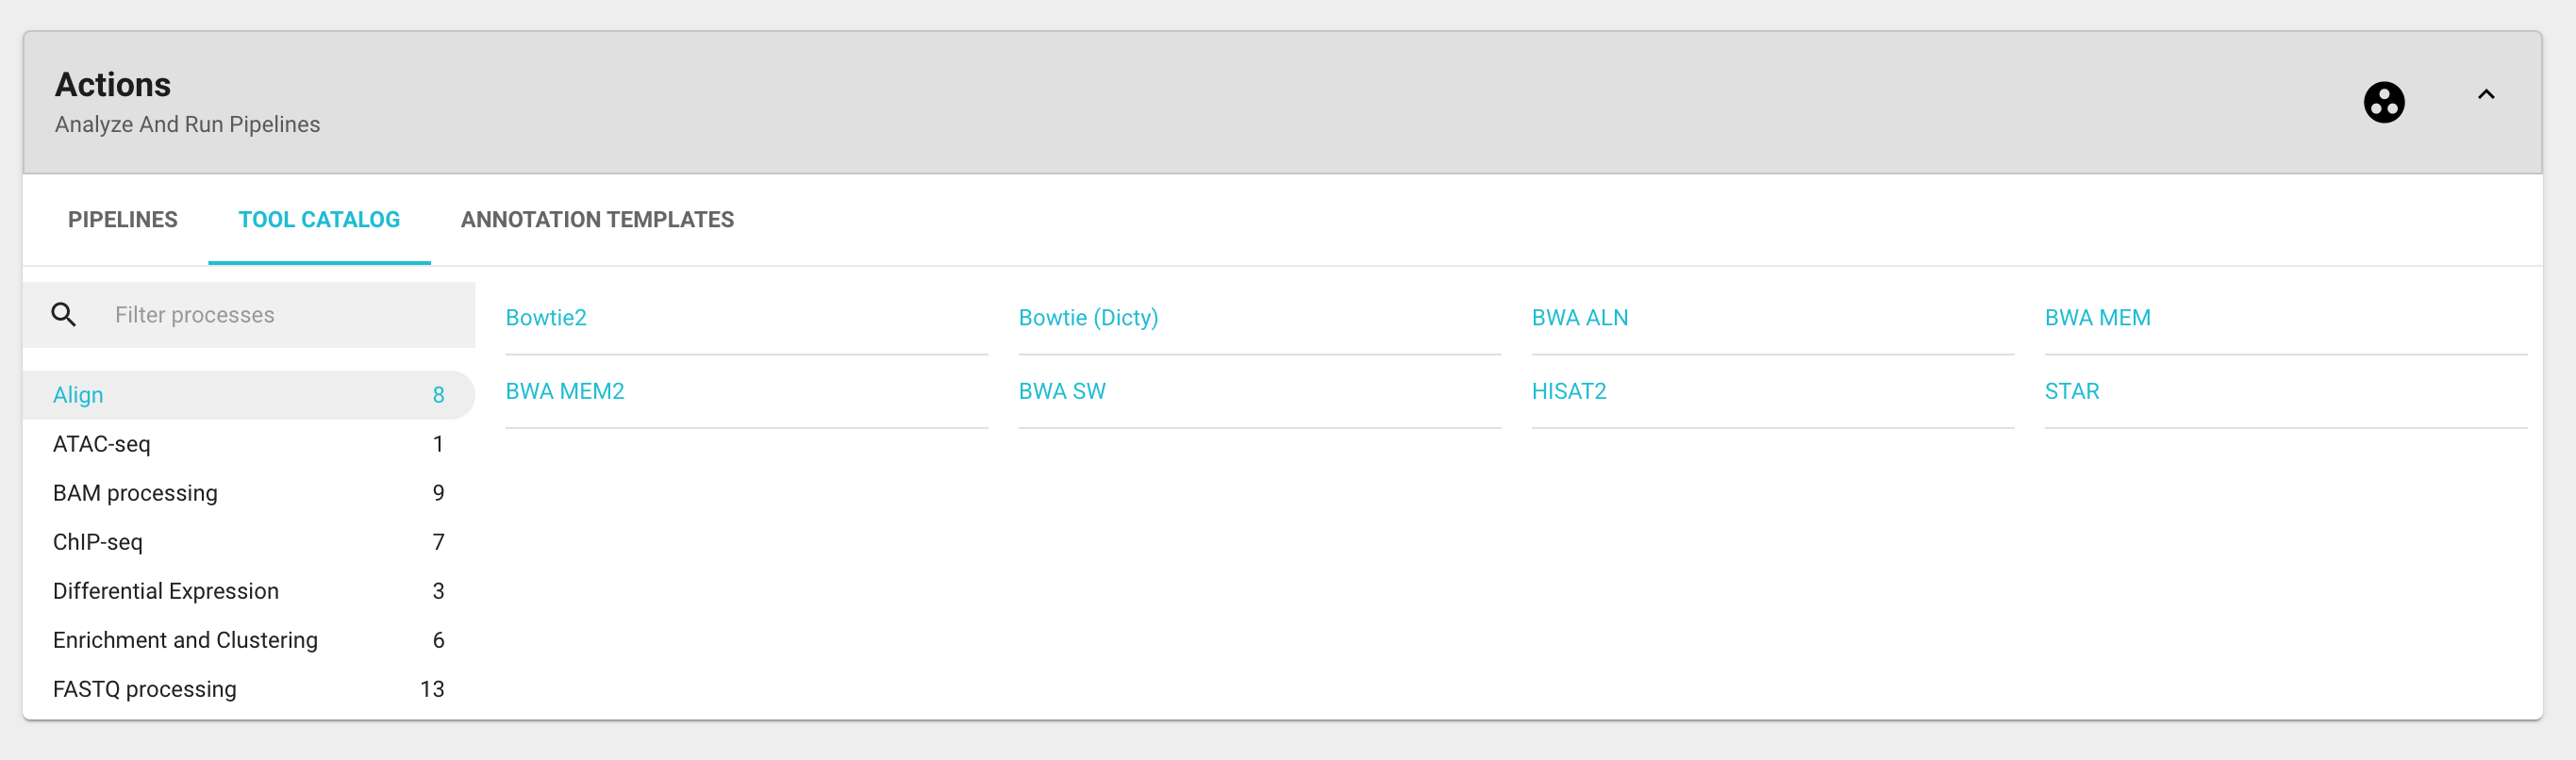
The Tool catalog tab is where you will find the a la carte tools that can be run on your samples or linked data objects. For further information on running the tools and processes, visit the Run Bioinformatic Tools and Pipelines article.
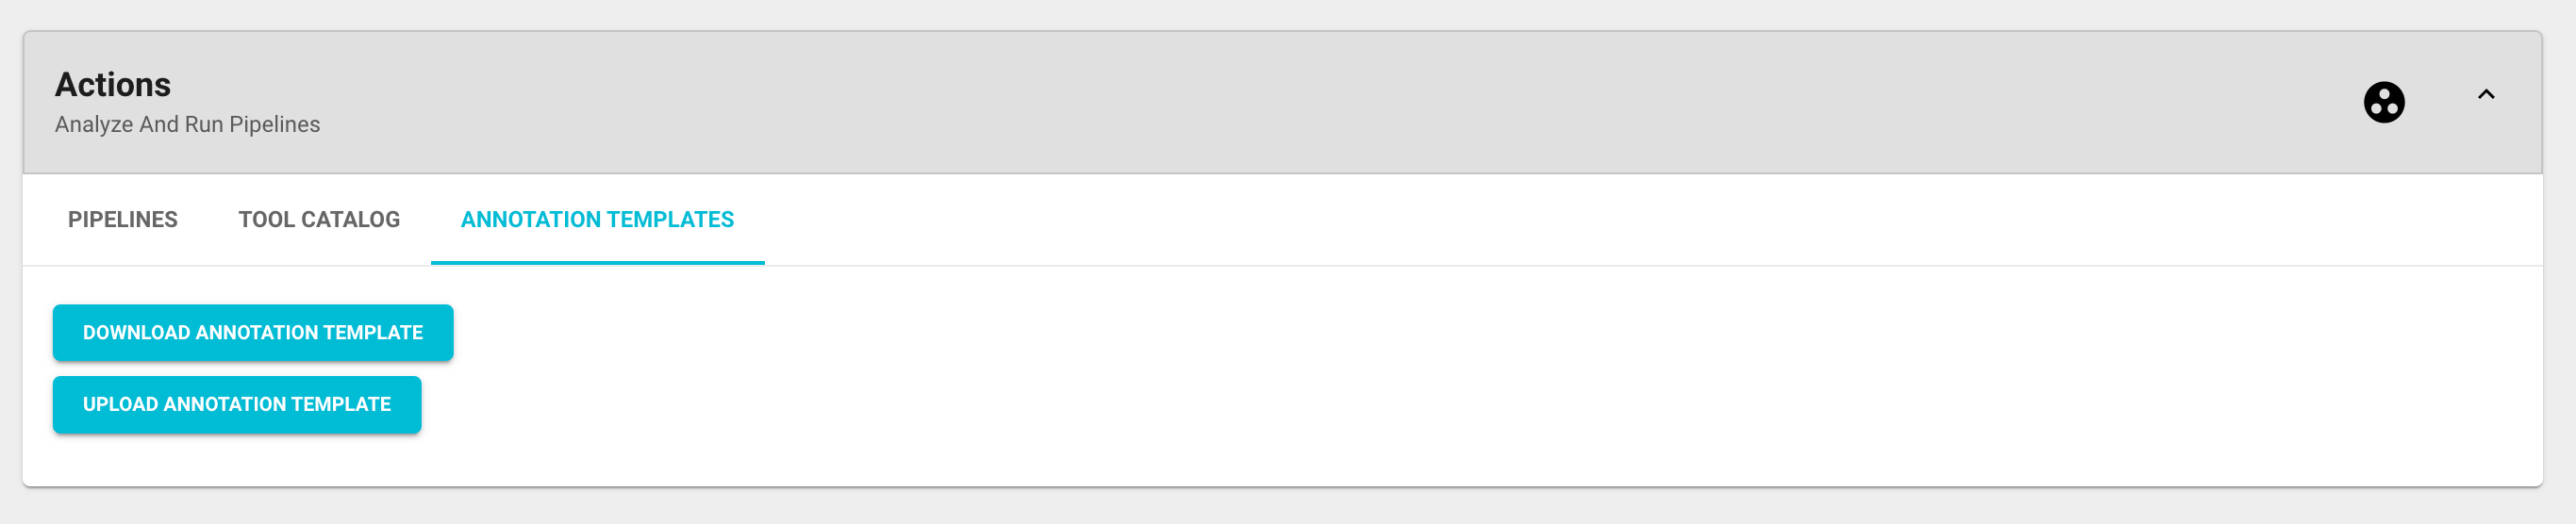
The Annotation templates tab is where you can download and upload Microsoft Excel spreadsheets for an easier and more streamlined sample annotation process. For more information on annotating samples visit the Annotate Samples article.
The ‘SET SAMPLE GROUPS’ icon button (baseline_group_work_black_24dp.png) will open a new page called Sample Relations that enables you to organize collection samples into meaningful groups or relations. Think of this as a way of describing your experimental design by assigning custom labels to specific groups of samples.

Sample Relations
Defining sample relations is another way of annotating your data and organizing them into meaningful groups with custom labels. The following relation categories are currently available:
Replicate
Genotype
Treatment
Background
Each sample relation category you have defined will appear as a new column in the sample table with your labels as color coded row entries.

Defining Replicate, Genotype and Treatment relations is always optional. You can assign these by first selecting a group of samples that belong to the same replicate/genotype/treatment group in the sample table and then clicking the ‘ASSIGN’ button. This will open a modal window where you select the appropriate sample relation category, define your custom group label and confirm by clicking the ‘ASSIGN’ button. Repeat this process to define all samples.

Background groups must be defined to run Chip-Seq pipelines.This means you need to assign a background to each of the experimental samples. In the sample table select all experimental samples with the same background, click the ‘ASSIGN’ button to open the modal window and select Background in the sample relation category dropdown. In the ‘Define sample relation details’ section select the appropriate background and confirm by clicking the ‘ASSIGN’ button. Repeat this process to define all samples, each background group will appear in a separate column.
If you make a mistake you can simply repeat the process of assigning relations and the new input will overwrite the old one. By clicking on the ‘CLEAR’ button you can delete all assigned sample relation categories or a specific one.
Samples card
The Samples card displays a table of all samples to which you have access, and each sample entry is equipped with basic information such as name, date of creation, the collection it belongs to, some quick access links etc.
In addition to the basic information, all analyzed sample entries display additional information in relation to the analysis procedure. The QC column holds the MultiQC report for each sample which you can download and view by clicking on the MultiQC link. The Alignment column and Results column hold sample analysis results which can also be downloaded individually or in bulk using the Download Quick action button.
Clicking on a sample name will open the Sample Details page. Use this page to learn about the analysis history of the sample or to view sample annotations.
Quick action icon buttons:
In order to visualize expression results, samples need to be added to the Sample Basket first by selecting them and then clicking the ‘Basket’ icon button.
Data associated with samples can be downloaded from the samples table by selecting the particular samples and then clicking on the ‘Download’ icon button.
You can create copies of samples and move them to another collection by using the ‘Duplicate‘ and ‘Move’ icon buttons. Note that in order to duplicate or move a sample you must have the ‘Edit’ permission on the collection you are working in.
Samples can be deleted by using the ‘Delete’ icon button. You will be prompted to confirm. Deleting a sample will also delete all its corresponding data objects. Be sure to use this option with caution, as there is no coming back once you delete something.
Data Objects card
The Data Objects card displays a table of all data objects to which you have access, and each sample entry is equipped with basic information such as name, type, date of creation, the collection it belongs to etc.
Clicking a data object name will open the Data Object Details page. Use this page to learn about the processing history of the data, including its inputs and outputs and to edit the data object’s name or URL slug.
Quick action icon buttons:
You can create copies of data objects and move them to another collection by using the Copy and Move icon buttons. Note that you can only duplicate or move data objects that have not been created as a result of sample analysis and are therefore not part of any particular sample.
Data objects can also be deleted by using the Delete icon button. You will be prompted to confirm. Be sure to use this option with caution, as there is no coming back once you delete something.
Collection Settings page

The settings for a collection can be viewed and managed on the Collection Settings page. You can access the settings by clicking on the ‘COLLECTION SETTINGS’ button found at the top right of the Collection Details page. The collection settings are organized in three cards:
General Settings: The General Settings card displays your collection name, URL slug, description, ID number, owner and time details regarding the collection. The first three items are editable, just make sure to save all new changes at the end by clicking the ‘SAVE’ button.
Permissions: You can share and manage permissions for a specific collection (and subsequently for all its corresponding samples and data objects) in the Permissions card. This card displays all users and groups that have access to this collection and their level of permissions. The current permissions levels for all the invited Users and Groups are listed under the ‘Who has access’ section, ranging from ‘Owner’ with full access and moving down through ‘Share’, ‘Edit’, and ‘View’ which is the lowest level of access. There is also an option to set the Public access which only has two permission levels: ‘View’ and ‘Off’.
Manage permissions:
New users/groups can be invited by using the invite forms and clicking the ‘INVITE’ button. You’ll need to know the exact name of the user or group to share data. If you are not sure, please contact support@genialis.com for assistance.
Permission levels for existing users/groups can be changed by selecting a different level from the dropdown and clicking the ‘SAVE’ button.
You can completely revoke permissions for existing users and groups by removing them from the list by clicking on the ‘X’ icon button next to the user/group name. Public access entry can’t be removed - you can simply select ‘Off’ from the dropdown menu next to it if you don’t wish for your data to be publicly available for all Expressions users. ‘Off’ is also the default Public permission level for all new data.
Danger Zone: You can delete the entire collection by clicking the ‘DELETE COLLECTION’ button. You will be prompted to confirm. Deleting a collection will also delete all its corresponding samples and data objects. Be sure to use this option with caution, as there is no coming back once you delete something.