Visualize: Differential Expression
Differential expression (DE) analysis is a powerful tool for determining statistically measurable differences in gene expression between two groups of samples. You can use this analysis to explore which genes are up or downregulated in response to a given experimental treatment or between two patient samples, tissues or genotypes.
You can perform DE analysis within the Visualizations page on the Differential Expression tab. Here you will see 4 cards:
The Differential Expression Selection card lets you create new DE analyses or select an existing DE analyses which you can then visualize in the adjoining cards.
The Volcano Plot card provides a visualization of the differentially expressed genes from the selected DE analysis.
The Differential Expression Comparison Table card displays a list of selected genes and their fold change (FC) values for up to four DE comparisons.
The Differential Expression Comparison Plot card provides a visual comparison of two DE analyses.
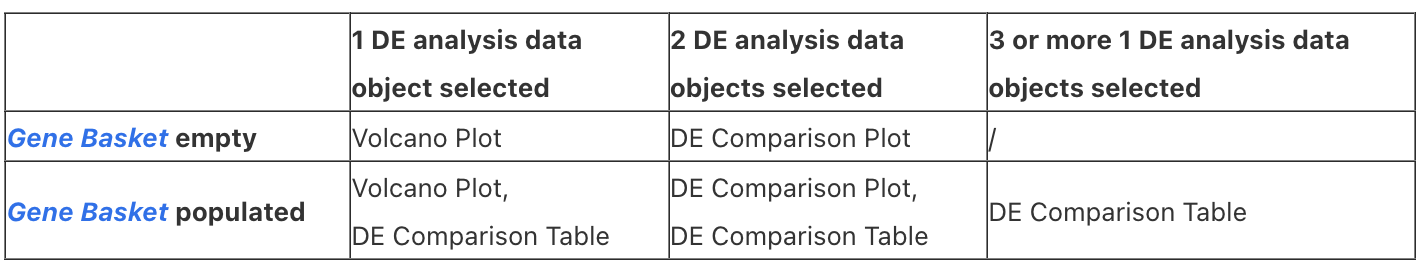
Different combinations of selected DE analysis objects and populated Gene Basket will trigger different visualization cards:
For further information about how to populate the Gene Basket see the Gene Basket article.
Differential Expression Selection card
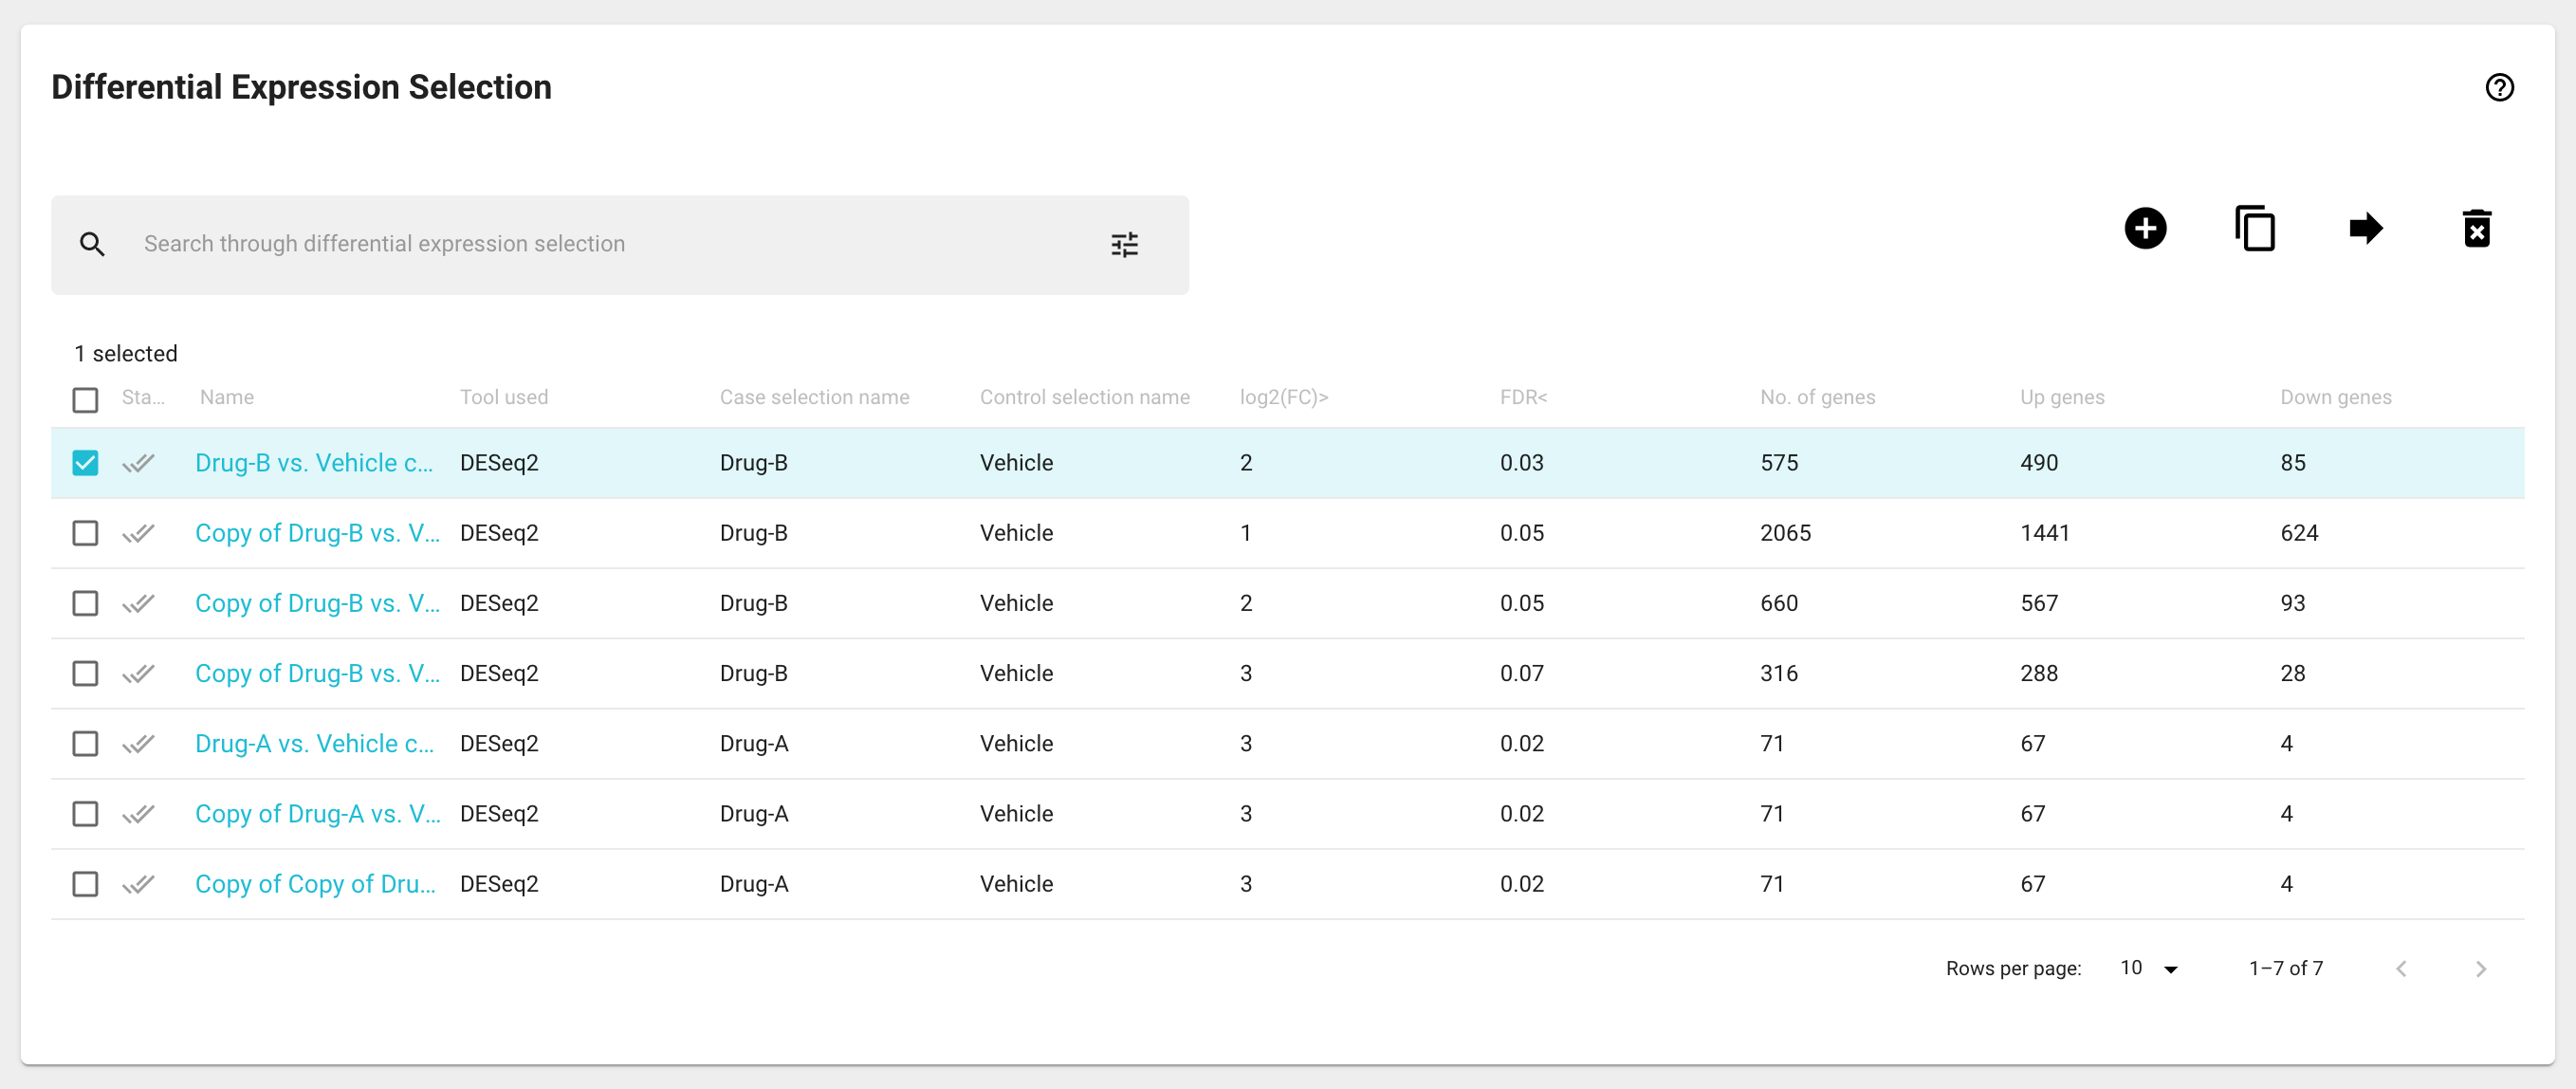
The Differential Expression Selection card displays all the DE analyses data objects you have created or have permissions to see. Each row represents a separate DE analysis displaying the DE name, the tool that was used to generate it, the names of case and control group, the log2(FC) and false discovery rate (FDR) thresholds, as well as the number of genes that are up and downregulated.
Selecting one or more DE analysis data objects will populate different subsequent visualization cards as described in the table above.
Clicking on a DE analysis data object will open the Differential Expression Details modal window (see below).
Quick action icon buttons
Several DE analysis data object management actions can be performed in the Differential Expression Selection card by selecting the desired table entries and then using the icon buttons located in the top right corner of the results tables:
To create a new DE analysis object, click on the ‘New DE’ icon button on the Differential Expression Selection card. A modal window will appear, where you will give your DE analysis a name, name your case and control groups, and select the samples from current Sample Basket content that will be in each of these groups. Once you have made all the necessary inputs, click the ‘CALCULATE’ button to run your DE analysis. This process will run the DESeq2 process on your samples, which typically takes 10-20 seconds. Once your DE analysis is finished, you will be able to see a newly created entry in the Differential Expression Selection card. If you have more than two groups in your experiment, you can set up DE analyses between each of the pairs of groups. We may be able to help you set up more complex comparisons, please contact us at support@genialis.com.
You can create copies of DE analysis objects and move them to a collection by using the ‘Duplicate‘ and ‘Move’ icon buttons.
DE analysis objects can be deleted by using the ‘Delete’ icon button.
View DE analysis details
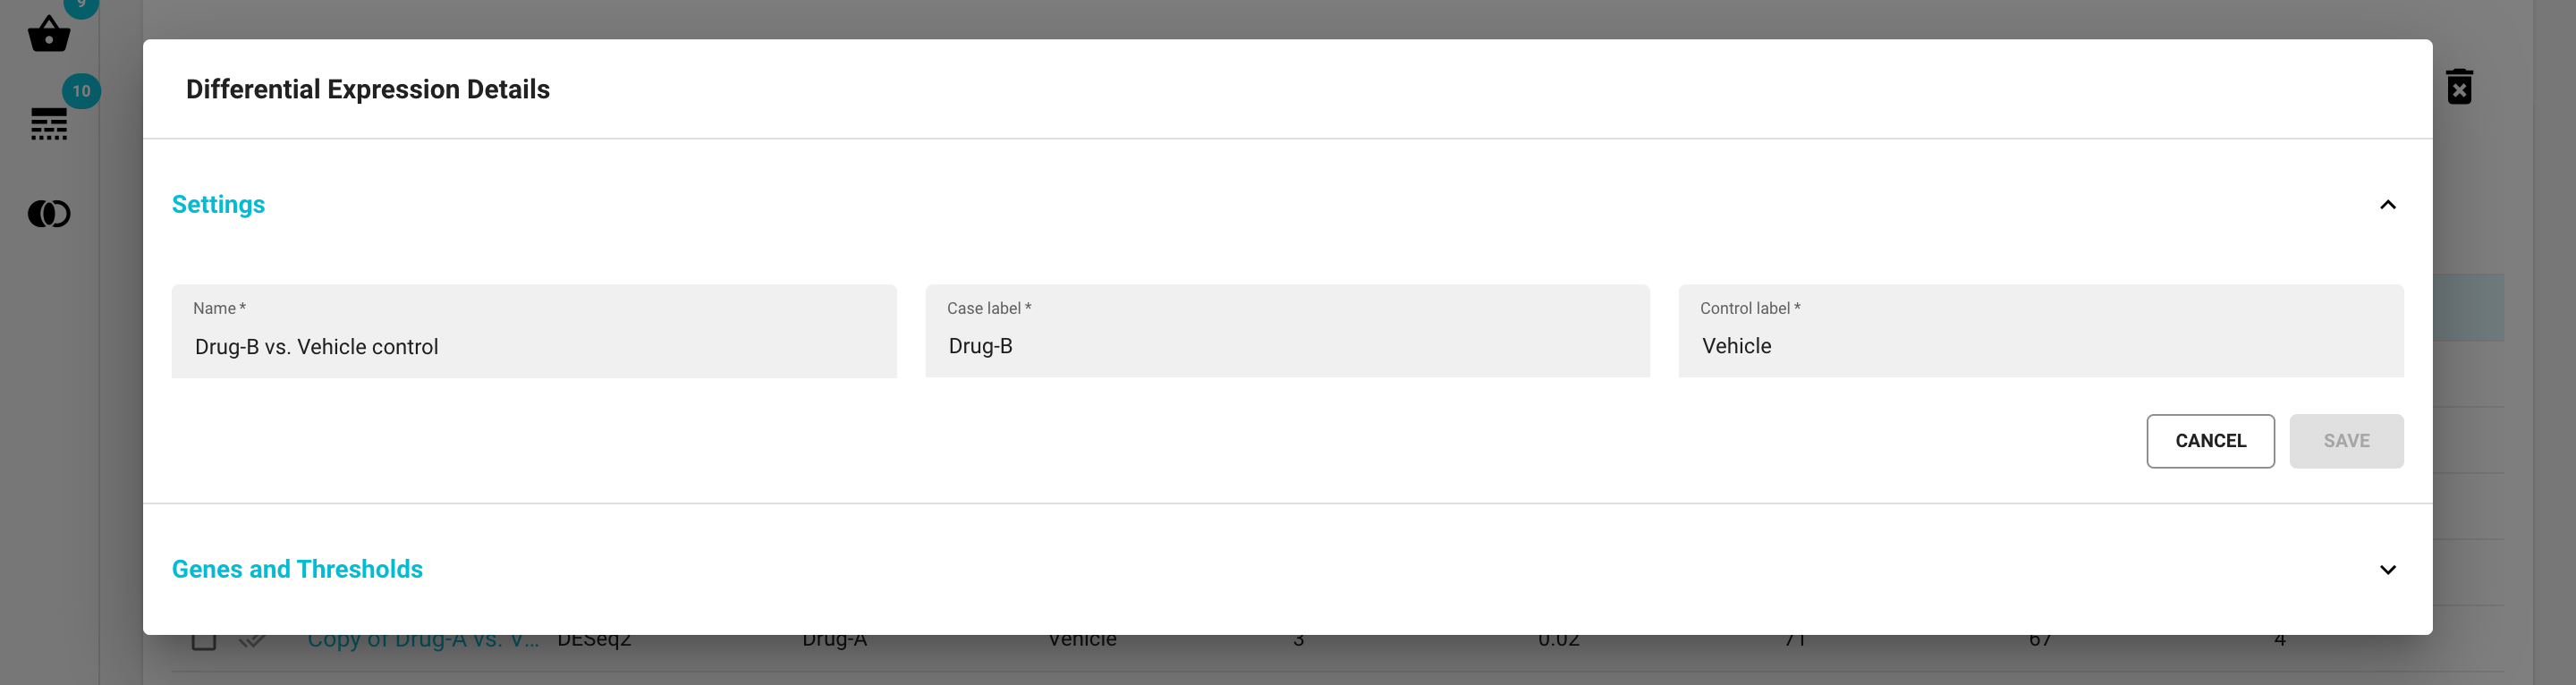
Click on a DE analysis name, and a Differential Expression Details modal window will appear. It consists of two separate sections in an expandable/collapsable harmonica format:
The Settings section
change the name of the DE analysis
change the names of the case and control sample groups
Note that after making any changes you’ll need to click the ‘SAVE’ button.
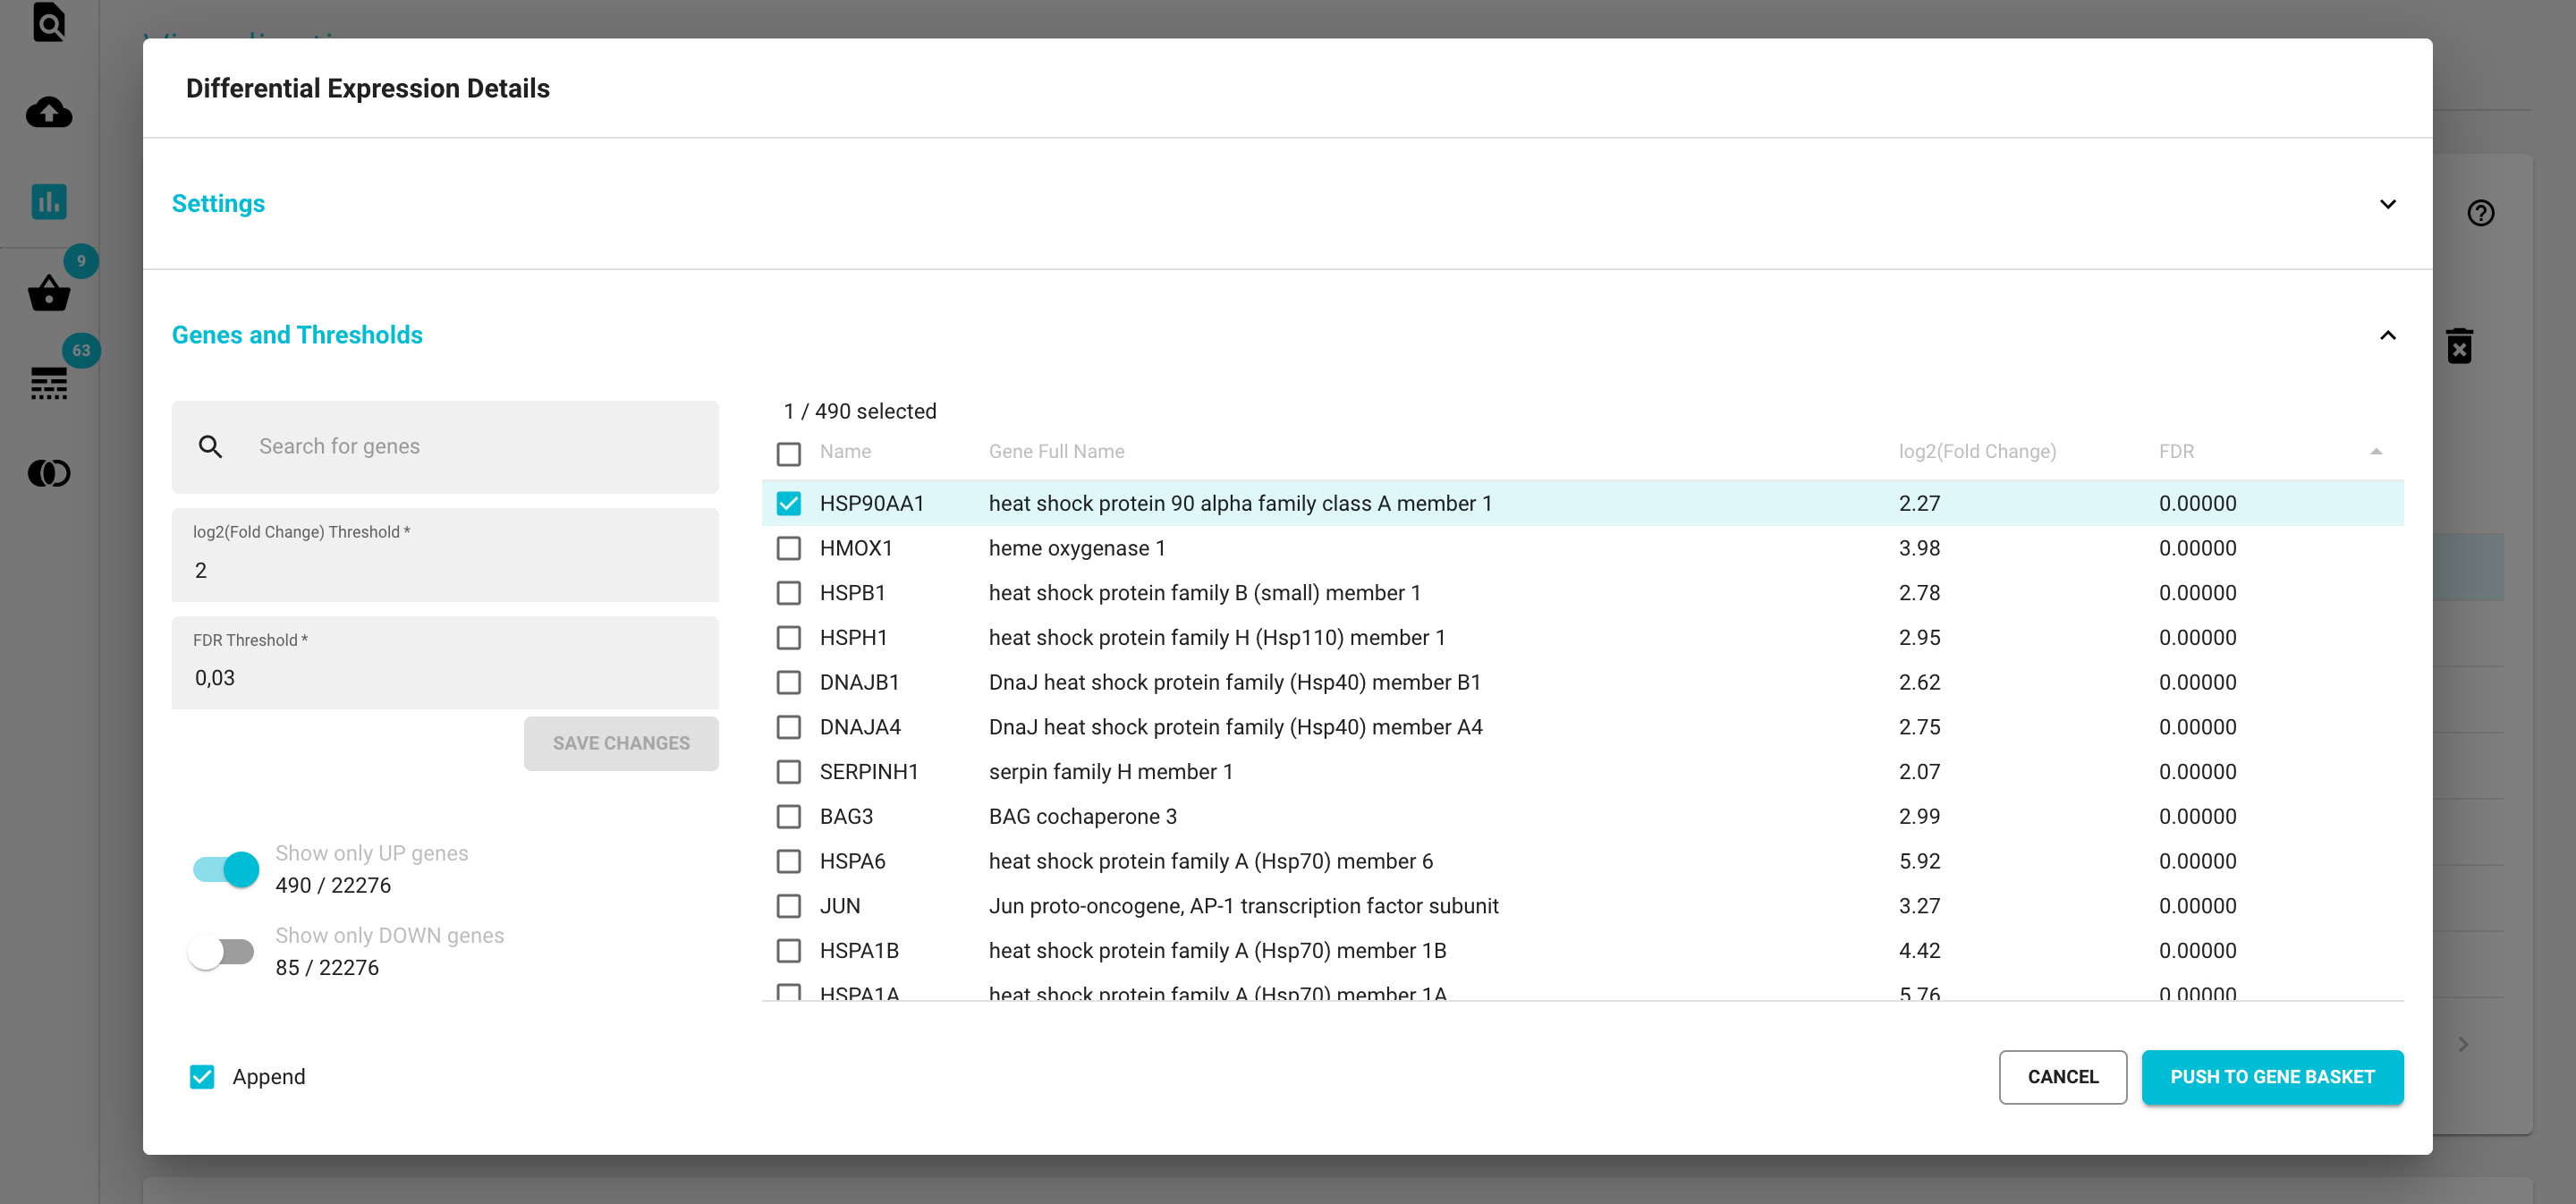
The Thresholds section
View, sort and filter the gene table based on the threshold values using the controls left of the table. If you change the values the table will adjust automatically.
Change the default threshold values for log2(FC) and FDR in the controls left of the table. If you click the ‘SAVE’ button your new thresholds will now be permanently saved with this DE analysis object, and the numbers of up and downregulated genes will be updated in the Differential Expression Selection card.
Select differentially expressed genes: Let’s say you’re only interested in the downregulated genes. Note that all of the upregulated genes have positive values, while the downregulated genes have negative values. First toggle the “Show only DOWN genes” switch and the table will only display the downregulated genes. Select all by checking off the ‘Select all rows’ icon in the header row and then click the “ADD TO GENE BASKET” button. By checking the ‘Append’ option you can also decide whether or not to append this selection to the existing Gene Basket content.
Volcano Plot card
The volcano plot has become an indispensable means of visualizing differentially expressed genes. Every dot is a gene, with relative fold change (log2 FC) on the x-axis and the statistic -log10 FDR (false discovery rate) on the y-axis. Thus the further from zero a gene is displayed, the greater the difference in expression level and/or statistical confidence we may infer.
The Volcano Plot card will get populated after you select a single DE analysis from the Differential Expression Selection card. Dots representing genes in the Gene Basket are shown larger and darker than the background, with the actively selected gene in blue. Mouse hovering over any dot reveals additional information.

Adjust the log2(FC) and FDR cut off lines
Outlier genes with log2(FC) > 10 are stacked by default, but may be toggled to display their actual value.
To temporarily adjust the thresholds, change the FC, log2(FC), FDR or -log10(FDR) values on the top of the Volcano Plot card. You will see the corresponding change in the cut off lines within the volcano plot. These changes will reset each time you select a different DE analysis or if you click on the ‘Reset thresholds’ icon button.
Permanent threshold changes can be saved in the Differential Expression Details modal window as described above.
Select differentially expressed genes from the Volcano plot
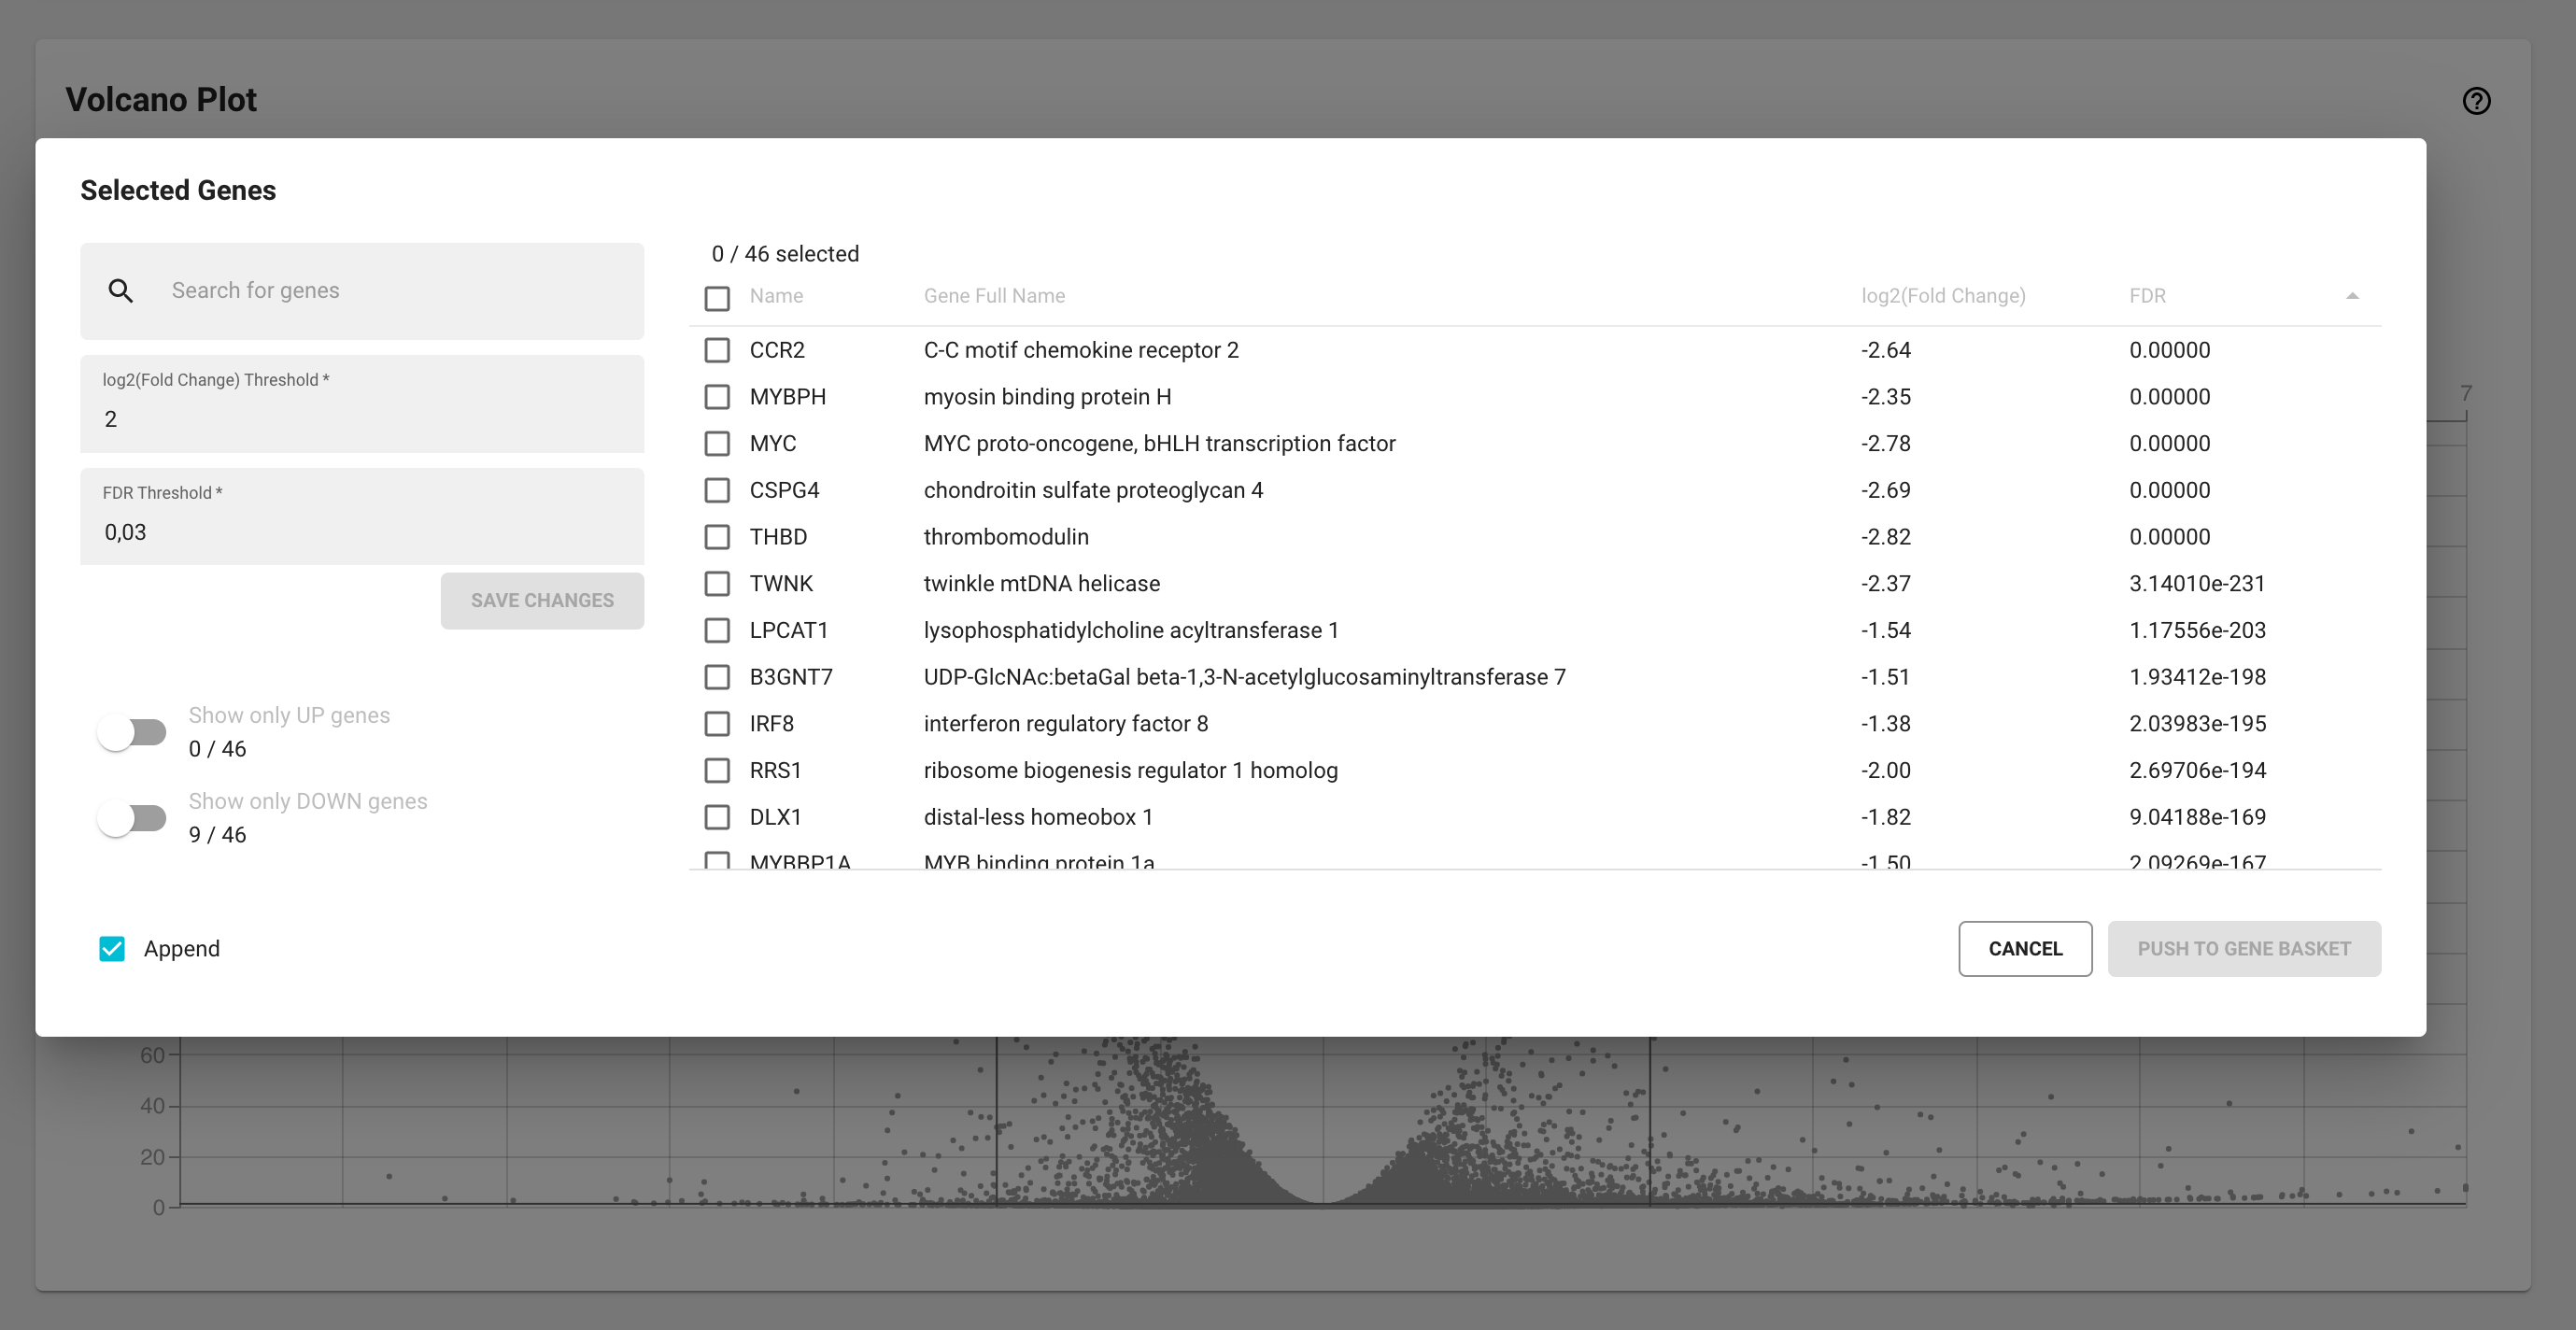
If you notice an interesting pattern or cluster of up or downregulated genes in the volcano plot, you can quickly select them by clicking and dragging with your mouse around those data points on the volcano plot. A modal window will appear with a table of all selected genes. This list of genes can be sorted or filtered using the log2(FC)/ FDR controls or the ‘Show only UP/DOWN genes’ toggles. You can select and add the desired genes to the Gene Basket in the same way as in the Thresholds section of the Differential Expression Details modal window (see above).
Differential Expression Comparison Table card
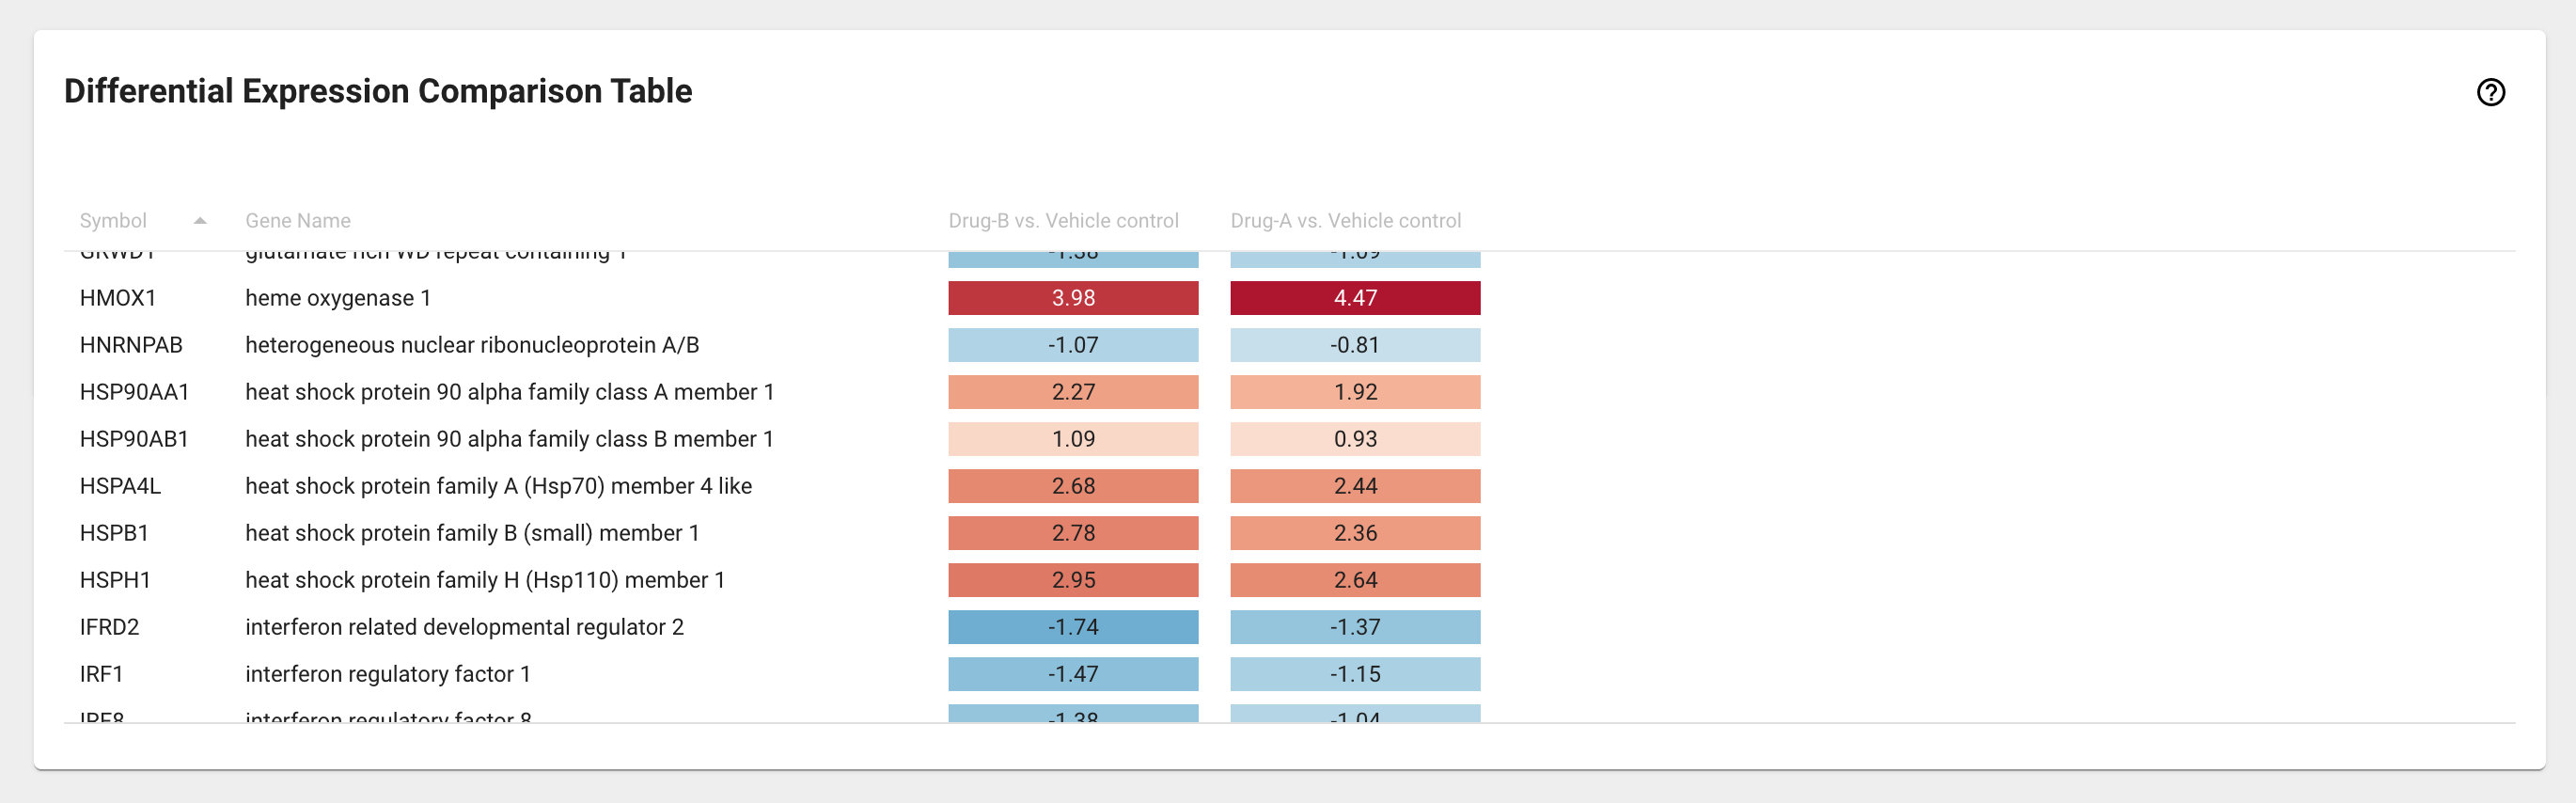
Differential expression comparison table displays a list of genes from the Gene Basket and their relative fold change for up to ten DE analyses you have selected from the Differential Expression Selection card.
The log2(FC) values are shaded on a color scale (e.g. like a heatmap) to facilitate detection of markedly different abundance patterns. The data are sortable by column, such that the gene list can be ranked for any of the selected DE analyses.
Differential Expression Comparison Plot card
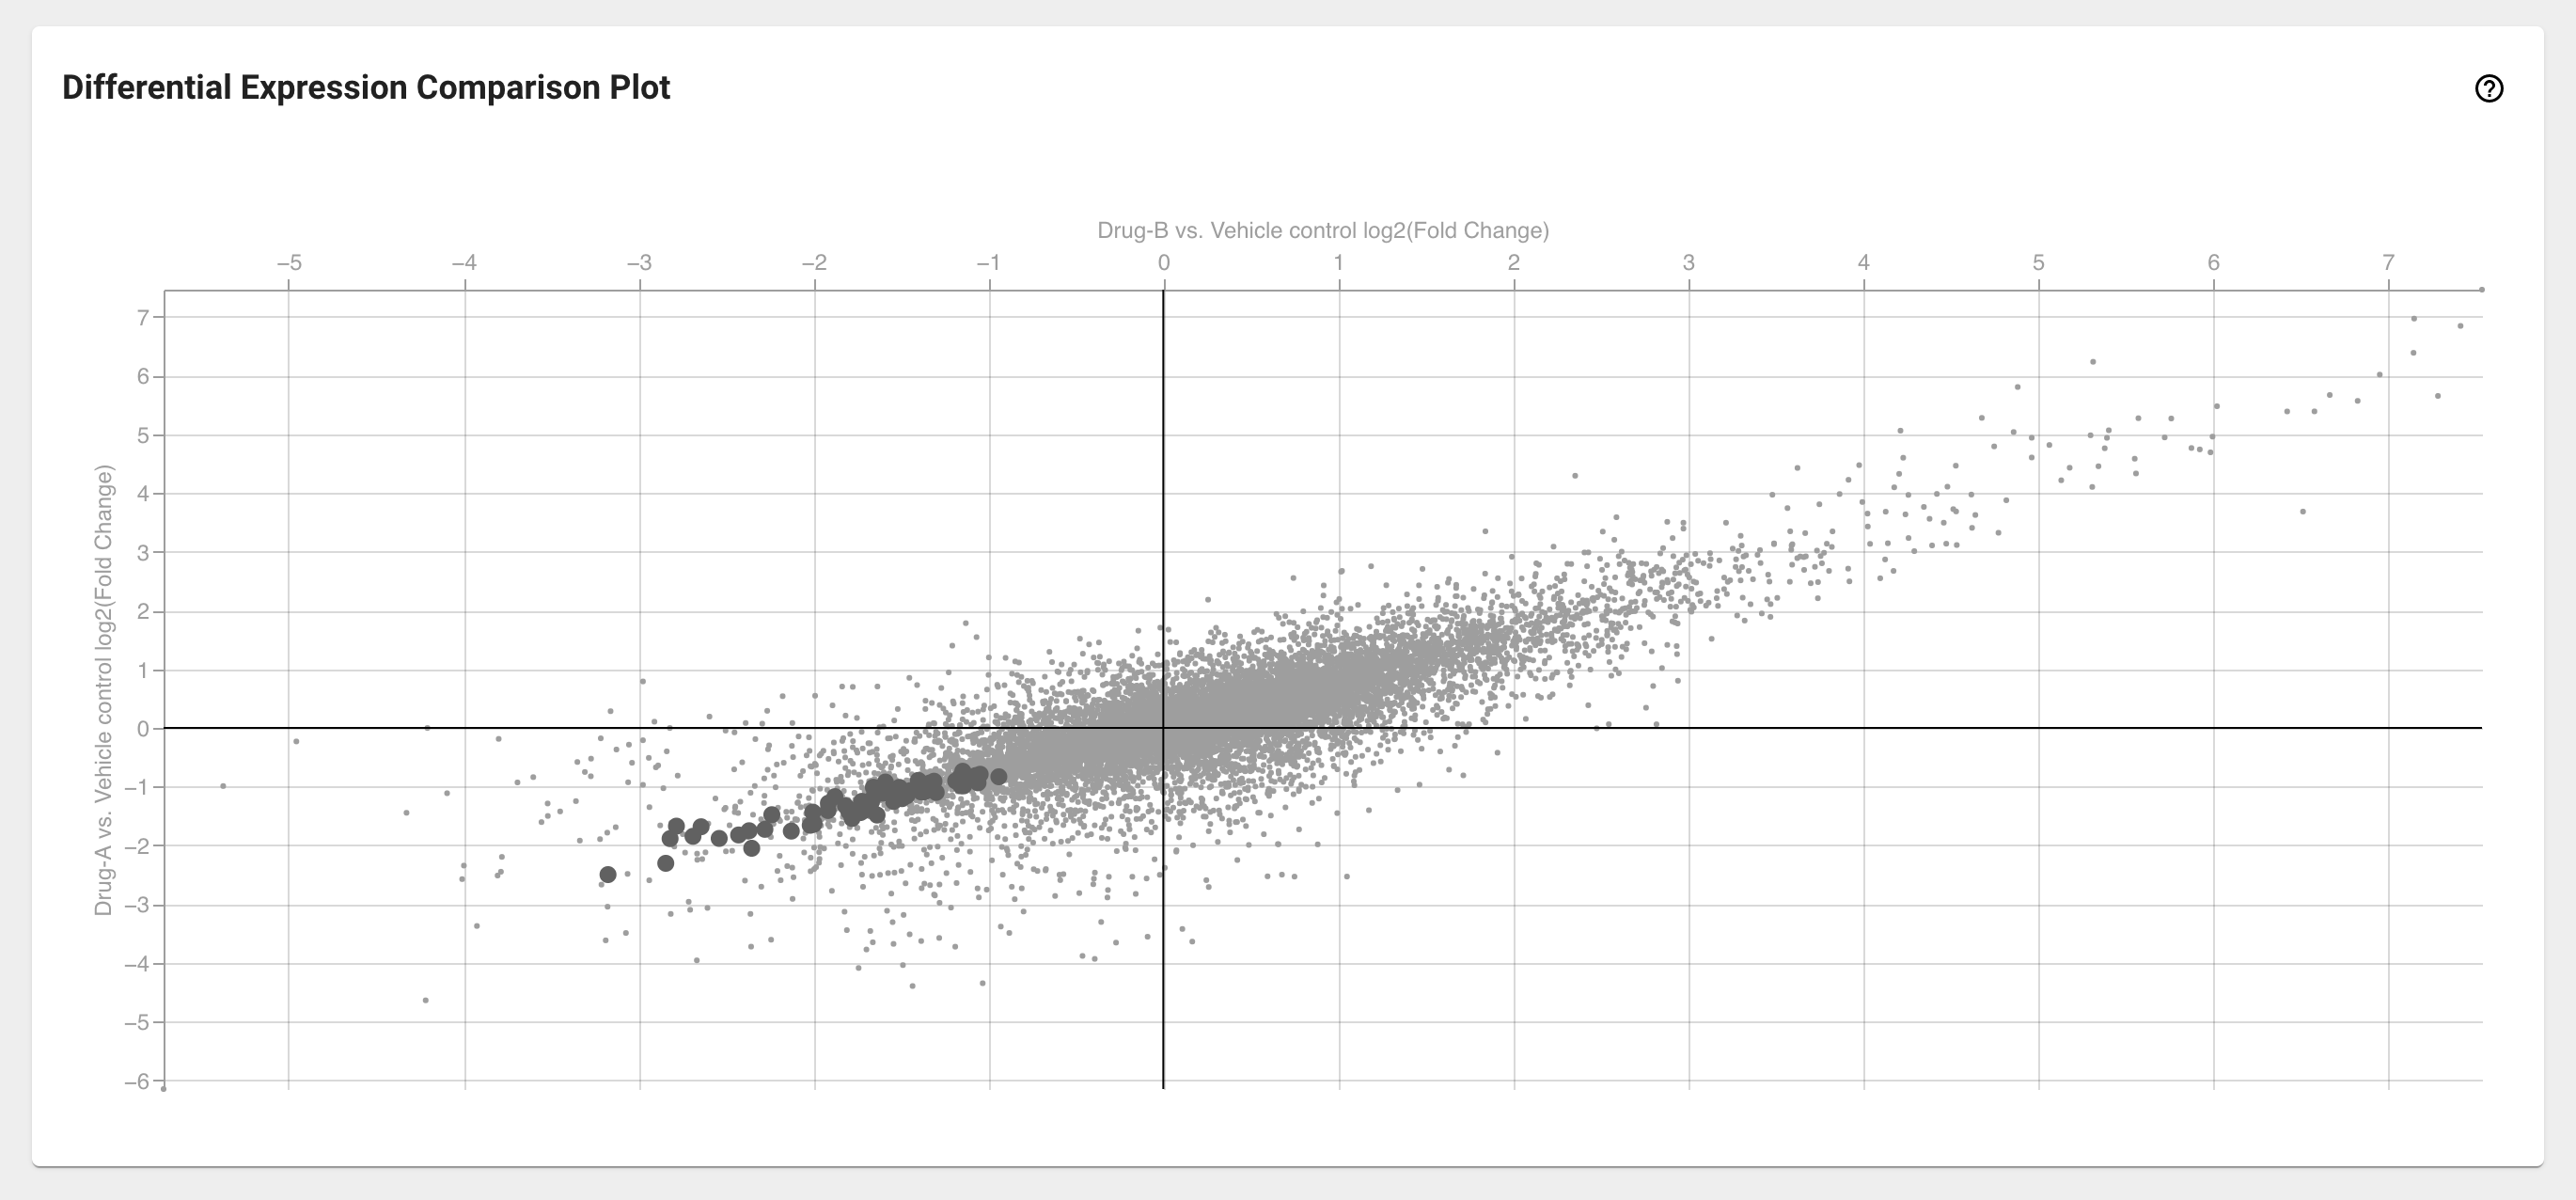
Selecting exactly two DE analyses from the Differential Expression Selection card will populate the Differential Expression Comparison Plot card. Here you can simultaneously compare the relative fold change of all the genes in the transcriptome. The axes of this plot represent the log2(FC) from the two selected DE analyses. Genes that fall along the x=y diagonal display similar abundance patterns in the chosen comparisons, while off-diagonal genes vary between experiments.
Select differentially expressed genes from the Differential Expression Comparison Plot
In the same way as in the volcano plot, you can quickly select genes from the DE comparison plot by clicking and dragging with your mouse around those data points on this plot.
A modal window will appear with a table of all selected genes. This list of genes can be sorted or filtered using the log2(FC)/ FDR controls or the ‘Show only UP/DOWN genes’ toggles. You can select and add the desired genes to the Gene Basket in the same way as in the Thresholds section of the Differential Expression Details modal window.
Download differential expression results
If you are interested in downloading your differential expression results, click on the ‘Export’ icon button in the top right of your screen (in the top bar). A modal window will appear where you can put down an optional prefix for the exported file and start the download by clicking the ‘EXPORT’ button.

This will download a zipped report file that contains folder:
- Differential Expression Selection folder:
Selected DE analysis information (.tsv*)
- Differential Expression Comparison Table folder:
DE comparison table (.tsv*)
- Volcano Plot folder:
A suggested caption text (.txt)
Raster and vector plot image (.png and .svg)
A table of genes where columns correspond to their log2(FC) value, -log10(adjusted pvalue) and adjusted pvalue. Columns with clamped versions hold values that have been adjusted to fit all values within a reasonable range of the volcano plot (.tsv*)
- Differential Expression Comparison Plot folder:
A suggested caption text (.txt)
Raster and vector plot image (.png and .svg)
A table of all the genes and their corresponding log2(FC) values in both DE analyses (.tsv*)
- Gene Basket folder:
Information about the highlighted and selected genes in the Gene Basket (.tsv*)
- Sample Basket folder:
A list of selected samples in the Sample Basket (.tsv*)
Note that the content will vary depending on the number of DE analyses you have selected and whether or not the Gene Basket is populated.
*TSV (tab-separated-value) format files are plain-text tabular files that can be imported into any spreadsheet program.