Run Bioinformatic Tools and Pipelines
This article will teach you how to use common bioinformatic tools and pipelines to analyze your data. All the controls you’ll need can be found on the View Collection Details page in the Actions card.
The Actions card contains three tabs where you can find the tools you need to analyze your data:
Pipelines
Tool catalog
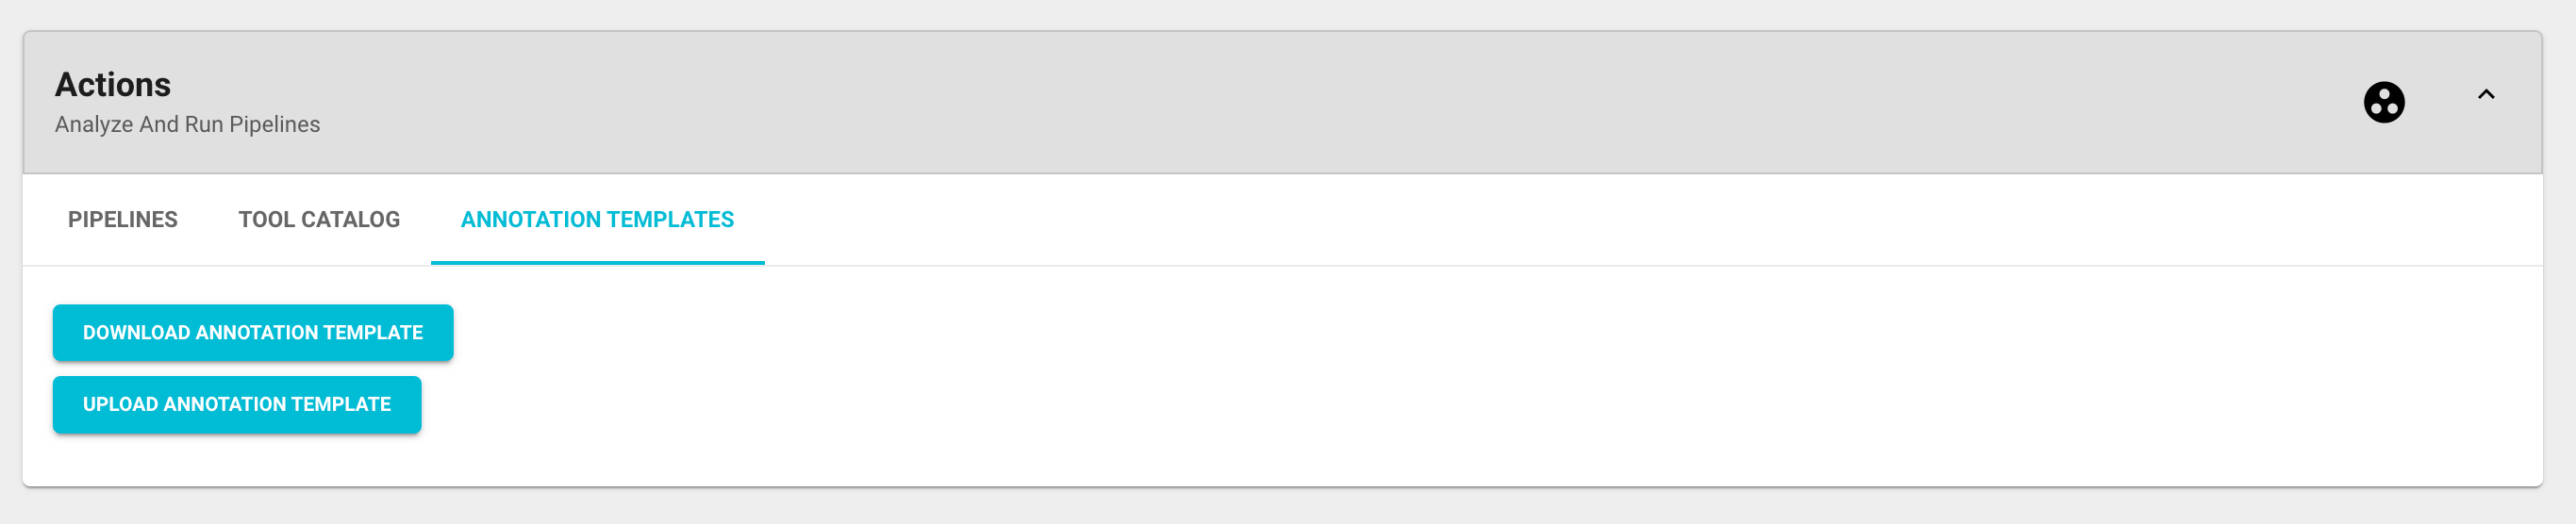
Annotation templates
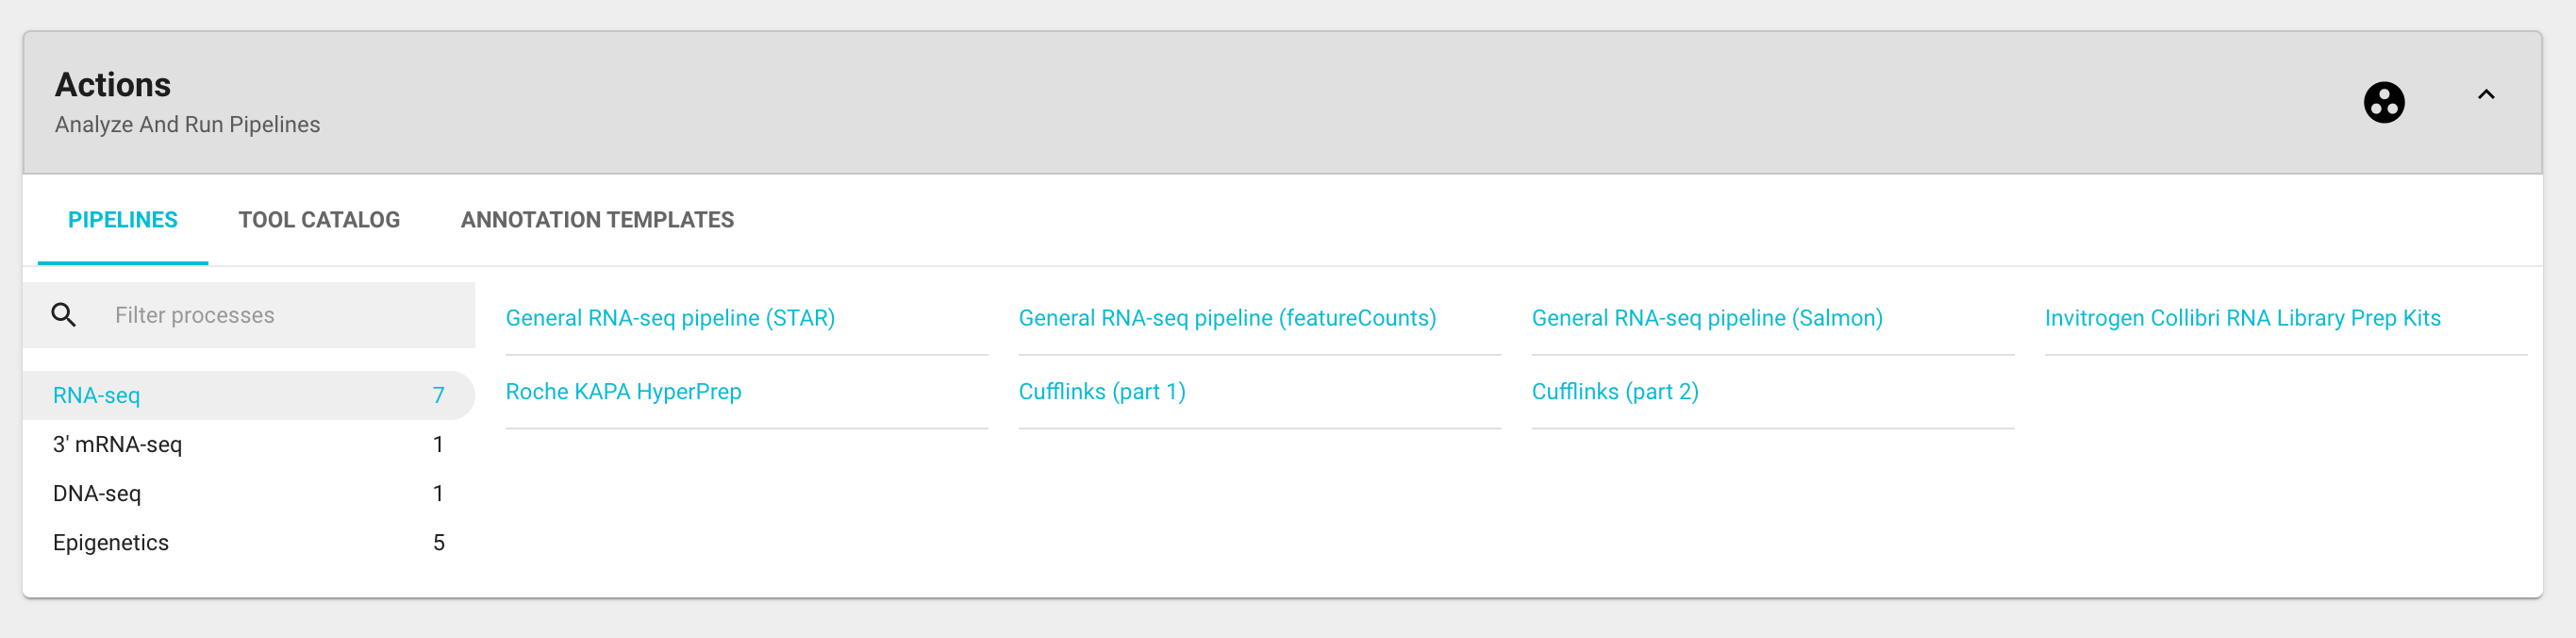
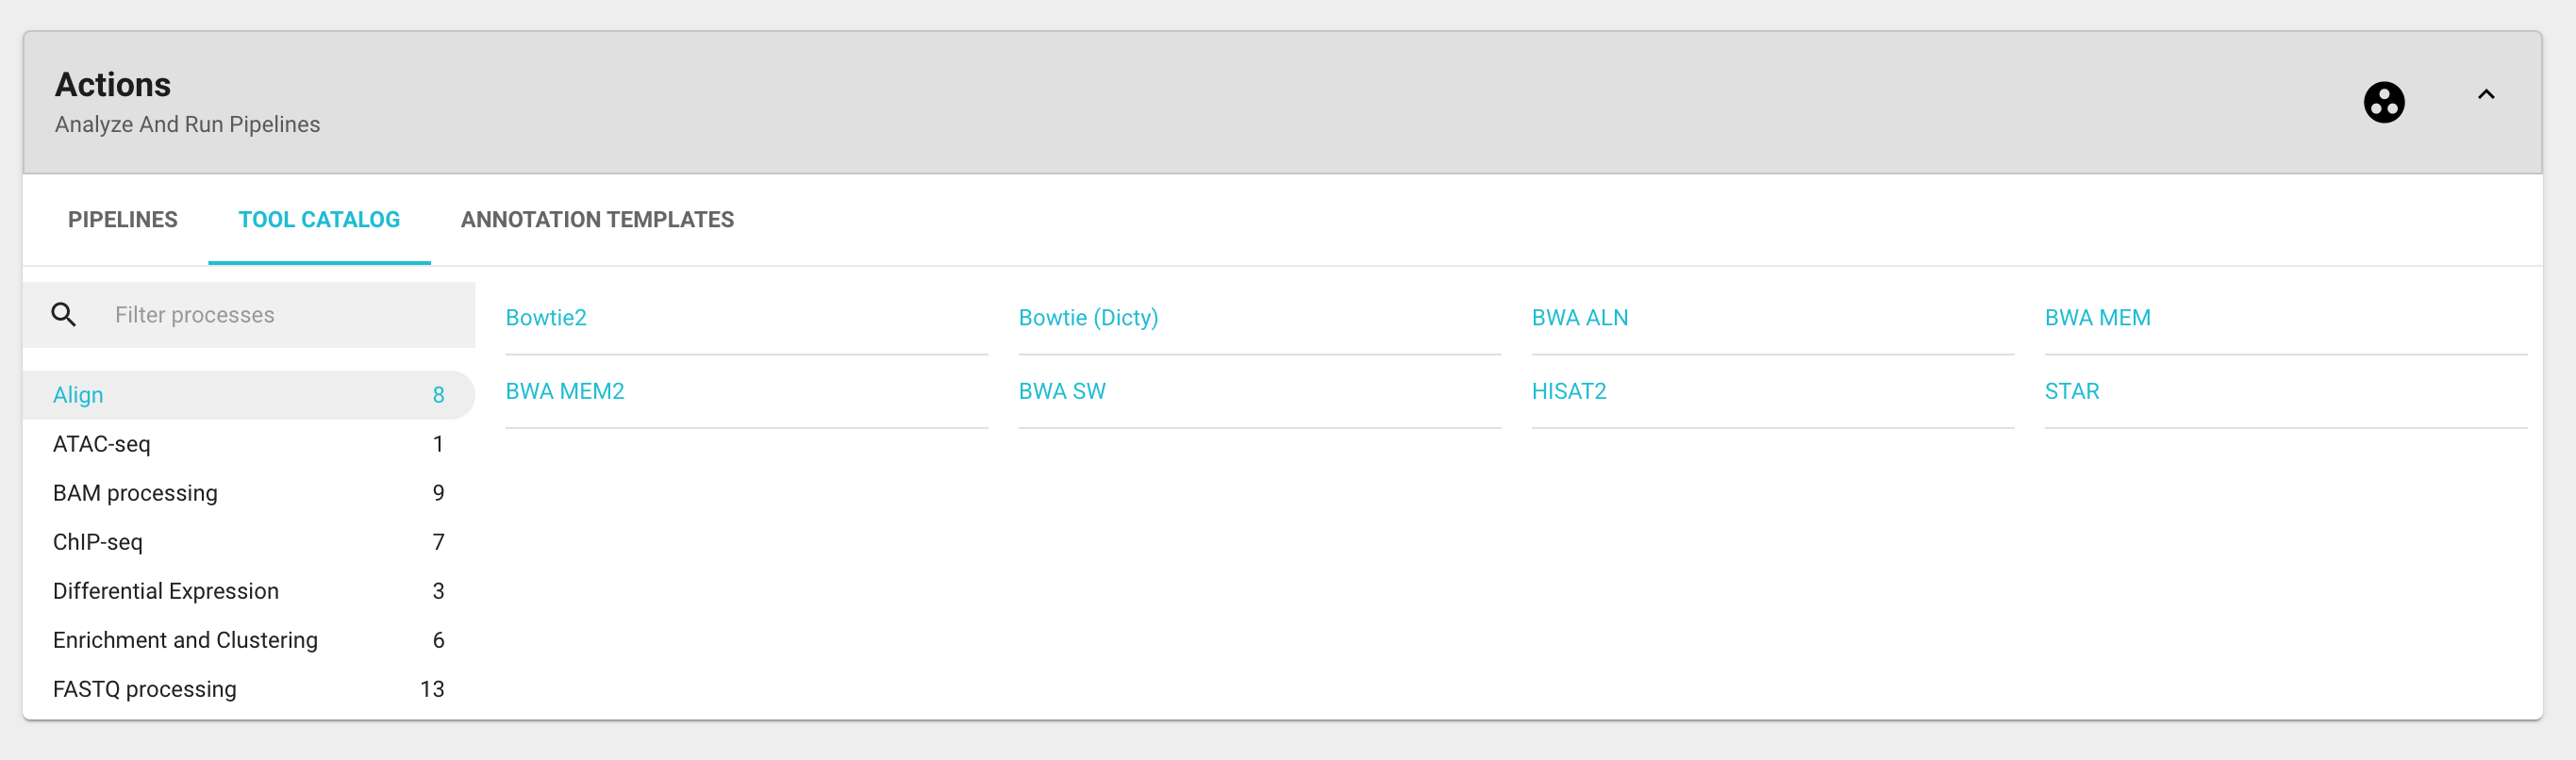
Depending on what your needs are, you can select a single tool among those listed in the Tool Catalog tab or a preset pipeline from the Pipelines tab to analyze your samples. The content of the Actions card may vary depending on your particular version of Genialis Expressions.
Selecting either a tool or a pipeline will take you to a Create Analysis page where you can select your samples of interest and modify the parameters of your choosing.
Create Analysis page
Create Analysis page contains three cards:
Description
Basic Parameters
Advanced Parameters

The selected pipeline or tool is shortly described in the Description card.
The Basic Parameters card is where you will define your inputs and parameters for the analysis. Usually all you have to do is just select the samples for which you wish to run the pipeline and press ‘RUN ANALYSIS’. The pipeline will be triggered using the default settings.
If you want to view and modify a number of advanced parameters and settings you can expand the Advanced Parameters card.

Reanalyzing samples
A common request is to be able to analyze raw data with an alternative pipeline. If you simply ran an alternative pipeline on selected samples, you’d end up with two sets of results on each sample (e.g. two BAM files, two expression tables, etc.). Unfortunately such samples cannot be viewed in visualizations as there is no way to instruct the visualization modules which set of results to use. For that reason, a preferred way to re-analyse data is to first duplicate a sample, delete all but the raw reads from that duplicated sample, and only then run the alternative pipeline. In that way, you’ll end up with samples that you can directly compare within visualizations.